An image of Jupiter captured on 21 April 2014. Credit: Paul Abel
The giant planet Jupiter is a popular target for amateurs as even a modest telescope will show its colourful bands and four bright Galilean satellites.
You can do more than just watch colourful cloud tops come and go, though.
Jupiter’s atmosphere is populated by all manner of interesting storms and features that you could spend a lifetime studying.
But on this occasion we’re confining our attention to one storm in particular – the Great Red Spot, a vast hurricane that has existed for centuries – and we’re going to show you how you can measure its size.
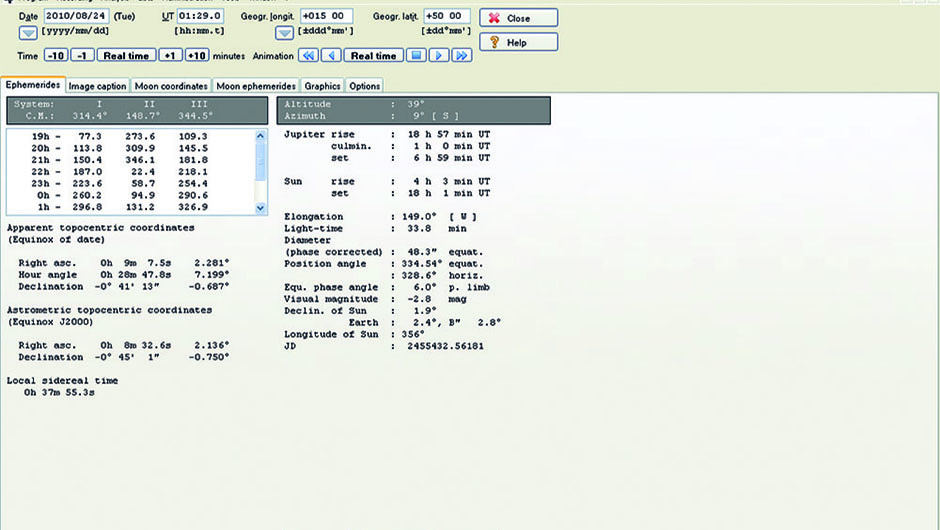
Software - WINJUPOS (to convert your transit times into System II longitudes).
Equipment - Telescope with an aperture of at least 6 inches, a logbook, a selection of medium- to high-power eyepieces (at least 200x to make the transit timings), a yellow filter (Wratten 15) and a blue filter.
Hot and stormy
Jupiter is a gas giant and, unlike Earth, has no solid surface.
A telescopic view reveals a planet crossed by dark belts and brighter zones.
In reality, this is the top of a very extensive and tumultuous atmosphere – wind speeds of 100m/s have been recorded.
It’s thought that the cloud deck is composed of three layers: ammonia clouds at the top, an ammonia hydro-sulphide layer beneath that and a dense layer of water clouds at the bottom.
Beneath this cloud deck is a vast region of molecular hydrogen and helium.
Even further down, the pressures and temperatures become so great that the molecular hydrogen and helium is squashed into a churning sea of metallic hydrogen and helium.
This strange, metallic ocean at Jupiter’s heart helps to generate the planet’s enormous magnetic field.
Jupiter gives out much more heat than it receives from the Sun and this difference in heat drives the powerful weather systems on the planet.
Since we can’t see beneath the clouds, much of our understanding of Jupiter is the result of long-term studies of its atmosphere.
The British Astronomical Association began these investigations in 1890, deriving many useful facts about the planet from amateur observations.
Today, many professional astronomers are attempting to model the planet’s dynamic atmosphere and amateur observations are of help here.
Such studies are crucial if we are to understand how gas giants form and evolve.
The belts and zones of Jupiter’s upper atmosphere are home to a variety of storms. Some are short lived, others can last for centuries.
The Great Red Spot is the largest and most enduring.
It can always be found in the Southern Equatorial Belt and although it may occasionally fade, it never truly disappears.
There’s some debate as to how old the spot is.
Certainly the current spot has been observed since 1879, and perhaps even earlier; it’s not clear if the spot reported by observers of the 1600s is actually the same one as we’re observing today.
Observations from the late 20th century show that the Great Red Spot has changed: it used to be much larger and redder than it is now.
And it has been slowly shrinking over time.
Sometimes the shrinkage seems to accelerate while at others it’s fairly constant; the reasons remain a mystery.
The long-term forecast for the Great Red Spot is unclear: will it continue to shrink until it vanishes or start to expand again?
The shrinking spot
Measuring the shrink rate of the Great Red Spot is a straightforward task.
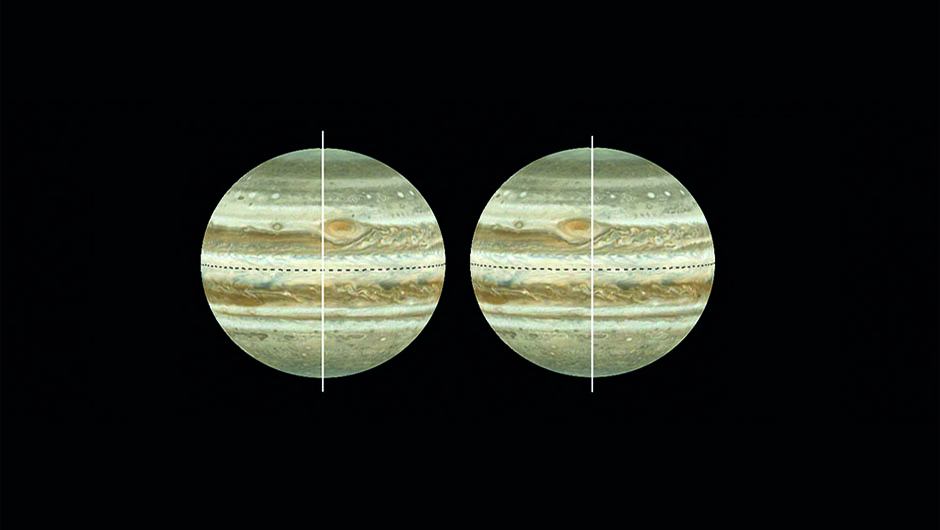
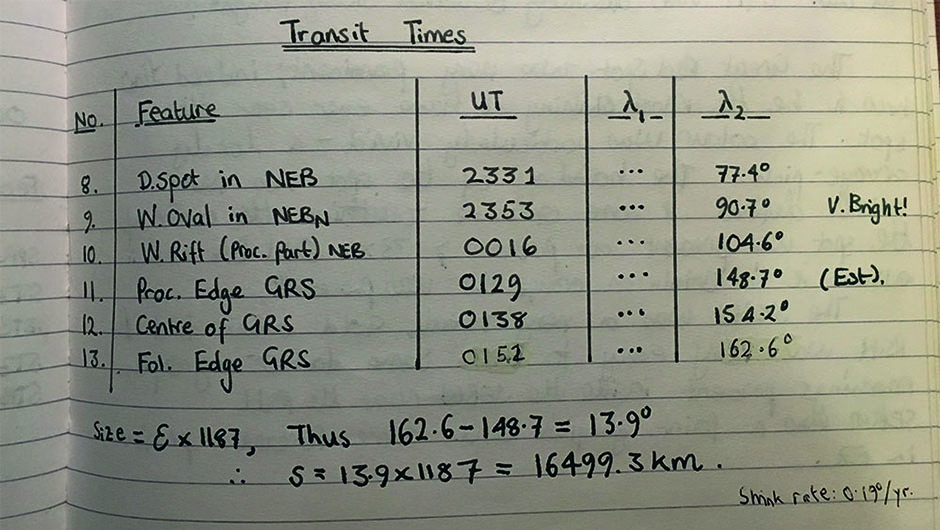
It doesn’t require any particular skill other than timing when the edges of the Spot lie on the Central Meridian.
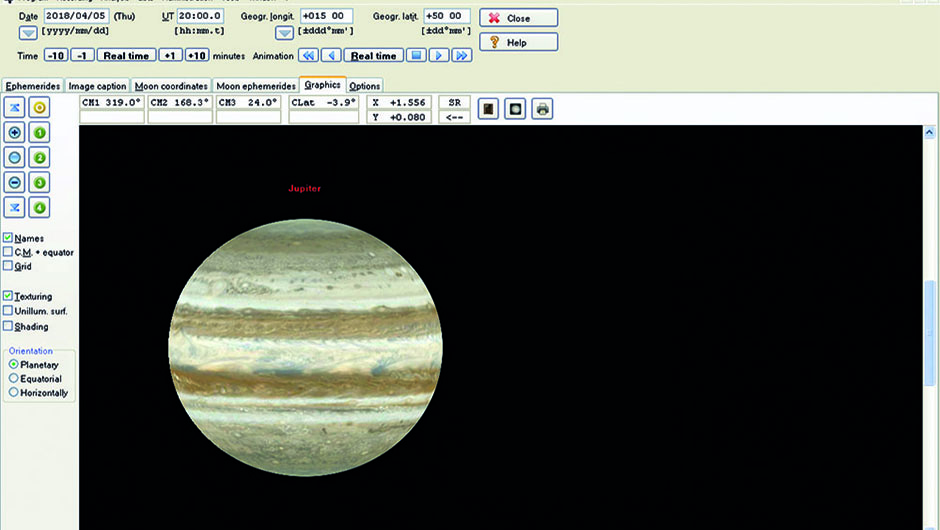
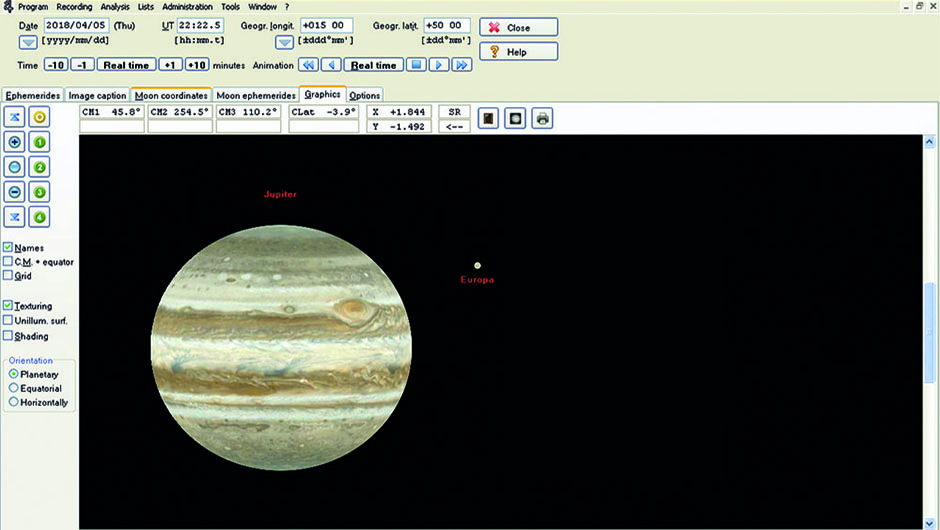
Using the free software WINJUPOSyou can then work out how large the Spot is in degrees and convert this into a size.
Although you can see the Spot in a 4-inch telescope, a 6-inch telescope will probably be required for his project as you’ll need a magnification of 200x or more.
This project requires a little planning as you’ll need to work out when the Great Red Spot is visible.
You should aim to measure it as often as possible and from these measurements you’ll be able to tell if the Spot is shrinking or remaining constant.
With Jupiter returning to the evening skies, now is the time to start your own investigations into the dynamics of the Solar System’s oldest hurricane!
