SS Cygni is a variable star in the northeast corner of Cygnus, the Swan. This is a cataclysmic variable consisting of two stars in close orbit around one another.
One is a red dwarf, the other a white dwarf. When we say close, this isn’t an exaggeration: they’re just 160,000km or less apart.
Being this close, the massively dense white dwarf pulls material from the red dwarf, forming an accretion disc around the white dwarf, with matter spiralling inwards.
Some of this hydrogen-rich material undergoes a runaway fusion reaction that raises the brightness of the system.

SS Cygni's variability
From Earth, SS Cygni typically presents itself as a 12th-magnitude star, but every 7–8 weeks it undergoes an outburst due to the fusion process, rising to eighth magnitude for 1–2 days.
This makes it a perfect target for small telescopes and, thanks to the backdrop of Milky Way star fields, there are plenty of comparison stars to use to make a magnitude estimate.
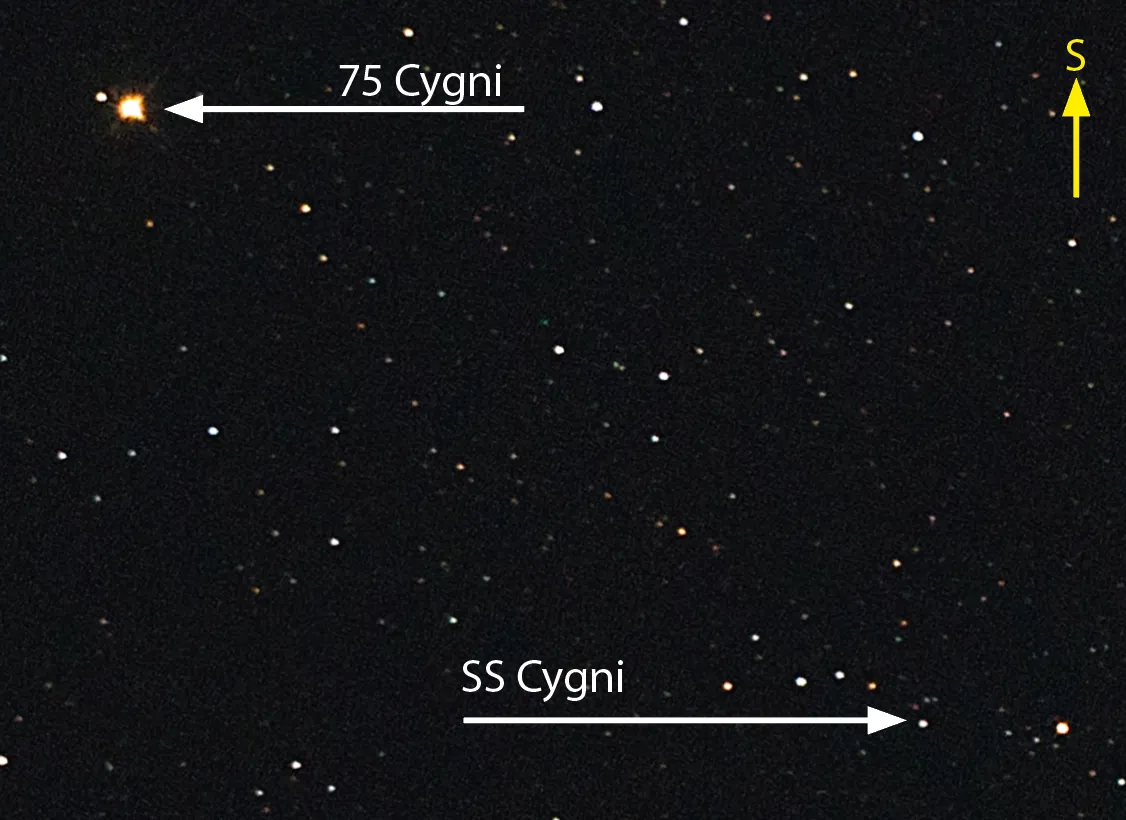
Use our chart below to locate SS Cygni.
SS Cygni is a relatively nearby dwarf nova cataclysmic variable, located 372 lightyears from the Sun.
The binary orbit is very short at just 6.5 hours, the orbital inclination of the system being around 50°.
The red dwarf is 55% as massive as our Sun, while the matter-gobbling white dwarf is 81%.

How to track changes in its brightness
SS Cygni is an amazing variable star in the constellation of Cygnus, the Swan.
Now we're going to look at how to observe, record and plot its light curve. The techniques can be applied to any variable star.
The first task is to locate SS Cygni. Use the general location chart above, together with the comparison chart below to identify the field of view.
Once you’ve located the correct field, take your time and get acquainted with the comparison stars shown.

There are various ways these stars can be used to record the brightness of a variable like SS Cygni.
One is to pick two comparison stars, one brighter than SS Cygni and one dimmer.
Once you have done this, make an estimate as to where SS would fit along a brightness scale between the two.
For more information read our guide on how to observe variable stars.
Ideally, for the best accuracy, choose comparison stars that are within 0.5 magnitudes of one another.
Subdivide the scale between the two comparison stars into three.
Using our chart, you might estimate that SS Cygni is dimmer than C but brighter than D.
Here you need to estimate where it would sit along the brightness line between both comparisons.
Say you estimated it to be one third along the line from D, and two thirds from C, you would write C(2)v(1)D.
Using this notation, ‘v’ represents the variable star, in this case SS Cygni.
Calculate SS Cygni's magnitude
Once you’ve made the observation, you can calculate the magnitude by dividing the difference between the two comparison stars, in this case 9.6–9.1 = 0.5, by the division scale, which is three.
Each division represents 0.5/3 = 0.17 magnitudes.
Using our example observation – (C(2)v(1)D) – the magnitude of SS Cygni is 0.34 dimmer than C and 0.17 brighter than D.
This gives 9.1+0.34 = +9.44 and 9.6–0.17 = +9.43. Accuracy to one decimal place gives SS Cygni’s magnitude as +9.4.
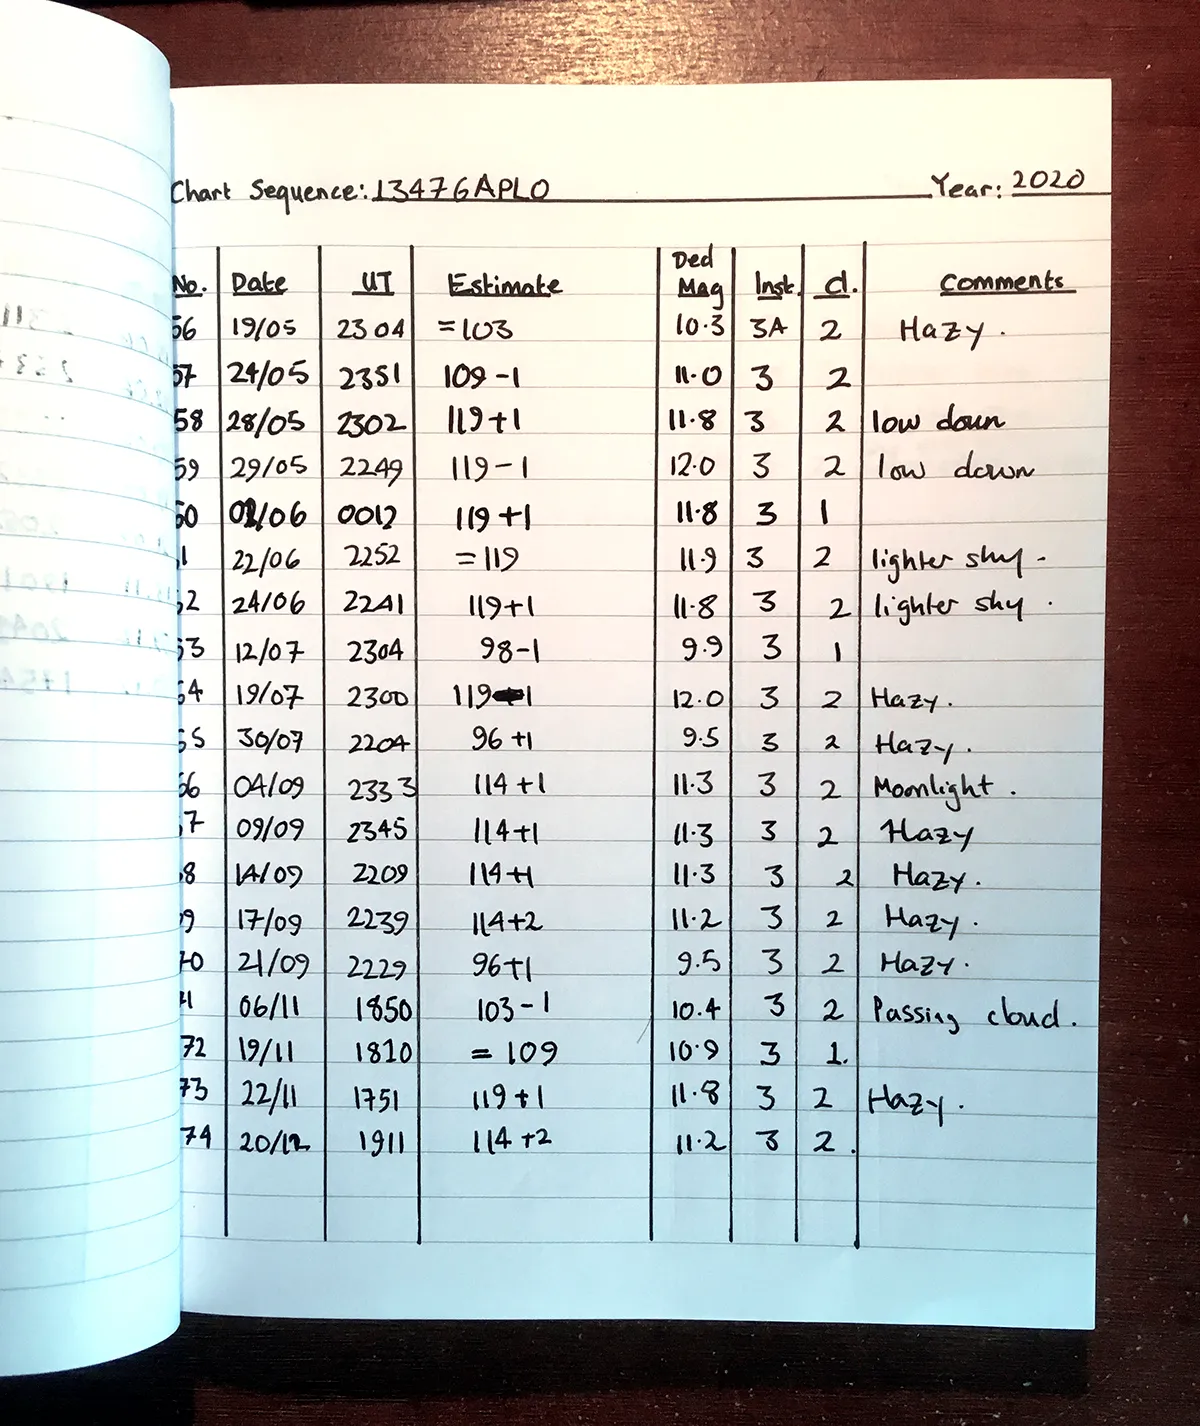
Now you have a magnitude, you’re ready to plot this point on a light curve.

This is the easy part: just create a graph with Date along the bottom and Magnitude up the side.
Make as many observations as you can, and over time you’ll see the star’s light curve being formed, and hopefully you’ll catch an outburst.
If you get a taste for this, there are many exciting variable stars out there to observe.
You’ll need comparison charts for each one – these can be readily obtained from organisations such as the British Astronomical Association, Society for Popular Astronomy and the American Association of Variable Star Observers.
If you take up the challenge of observing or photographing a variable star, let us know how you get on by emailing contactus@skyatnightmagazine.com