Without its stellar spectral classification, a star is merely a point of light and stellar astronomy is limited to astrometry, the study of their position and motion.
A spectrally classified star becomes a wealth of information.
When you next head outside on a winter's night, look up at the constellation of Orion and the seven bright stars that make up the most famous part of its outline.

Stare at them for a moment and you will realise something you probably took for granted: Betelgeuse (Alpha Orionis) is a distinctly different colour to the others, with a clearly ruddy hue.
Keep looking, and you will be able to spot subtle colour differences between the remaining six as well.
You may have noticed in general that some stars are red, while other stars are blue.
A star's colour and surface brightness (light output per unit area of surface) are determined by temperature, and luminosity (total light output) by a combination of surface brightness and size, which may also give a good indication of its stage of evolution.
By comparing its luminosity with its magnitude, we can obtain an estimate of its distance.

A history of stellar classification
In the 19th century, when the science of spectroscopy was emerging, Italian astronomer-priest Pietro Angelo Secchi devised a simple system of stellar spectral classification based on colour temperatures and the nature of any dark lines he could see in the spectrum.
As spectroscopes improved and more detail became apparent in stellar spectra, it became clear that Secchi’s system needed to be refined.
The director of the Harvard College Observatory, Edward Pickering, undertook this work and in 1890 he devised a system that used the letters A to Q in alphabetical order.
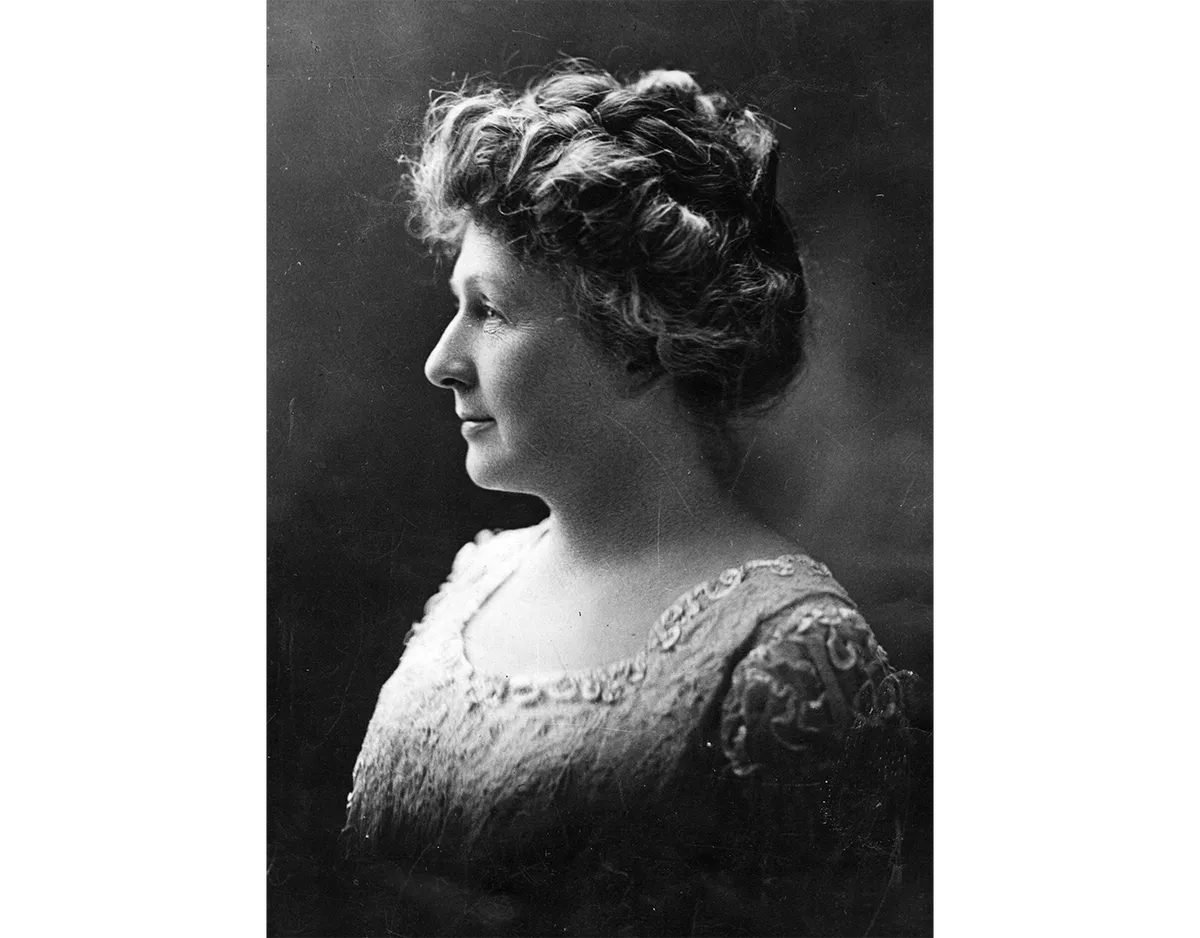
Although Pickering was responsible for the work, the actual stellar classification was performed by three women: Willimina Fleming, Antonia Maury and Annie Jump Cannon.
Over the ensuing years, Pickering, Fleming and Maury refined and simplified the classification, removing and re-ordering some of the classification letters in the process.
By 1901, Maury and Cannon realised that they could classify nearly all stars into a continuous sequence if they organised the stars by their colour temperatures, from hot blue to cool red, and reduced it to the familiar seven letters, OBAFGKM.
The stellar classification mnemonic to remember stellar classification is Oh Be A Fine Girl, Kiss Me or Oh Be A Fine Guy, Kiss Me.
You may still find the OBA end referred to as ‘early’ and the GKM end as ‘late’, harking back to the obsolete notion that stars simply cool as they age.
Cannon added precision with a decimal classification that plots the positions of stars between two defined letters.
For example, a star whose characteristics lie midway between those of A and F would be an A5.
She also introduced a lowercase letter classification, for any bright lines in the spectrum.

Stellar luminosity classes
Over the next four decades there were several tweaks to the system, the most significant of which was the addition of luminosity classes in 1943.
These are:
- 0 – hypergiants
- la – very luminous supergiants
- Ib – less luminous supergiants
- II – luminous giants
- III – ordinary giants
- IV – subgiants
- V – main sequence stars (aka dwarfs)
- VI – subdwarfs
This system of classification, in which the Sun is a G2V star, has been so successful that it has remained largely unchanged for nearly 75 years.
It is embodied in the Hertzsprung-Russell diagram, shown above, which is a two-dimensional plot of stars according to their temperature and luminosity.
Expanding the stellar classification list
A young star joins the main sequence as a dwarf.
As its hydrogen is exhausted, the star leaves the main sequence and becomes a giant.
A Sun-like star will eventually throw off its outer layers as a planetary nebula, while the nuclear reactions subside and all that remains is an inert, cooling, white dwarf.
Stars larger than eight solar masses will evolve more rapidly, executing complicated loops on the Hertzsprung-Russell diagram, before exploding as supernovae.

As our knowledge increased, more classifications have been added.
The cool red and brown dwarfs are classified as L, T and Y, so the full spectral sequence runs OBAFGKMLTY.
There are also some stars that don’t fit and run parallel to the sequence.
These include the Wolf-Rayet stars (W) at the hot end, and the Carbon (C) and very rare S stars at the cool end.
Examples of each of the main categories in the winter sky are (main sequence and giant/supergiant respectively):
- O – Sigma Orionis, O9.5V; Alnitak
- (Zeta Orionis), O9.5Ib
- B – Gomeisa (Beta Monocerotis), B8V; Rigel (Beta Orionis), B8Ia
- A – Castor (Alpha Geminorum), A2V; Deneb (Alpha Cygni), A2Ia
- F – Procyon (Alpha Monocerotis), F5IV-V; Polaris (Alpha Ursae Minoris), F7Ib
- G – Kappa Ceti, G5V; Mebsuta (Epsilon Geminorum), G8Ib
- K – 61 Cygni A, K5V; Pollux (Beta Geminorum), K0III
- M – No easily visible main sequence red dwarfs; Betelgeuse (Alpha Orionis), M2Ib
Once you develop a feel for spectral types, especially if you take it further and learn to decrypt the code embedded in the dark absorption lines and bright emission lines in a spectrum, a simple point of light becomes an interesting friend with a character of its own.
It’s worth the effort.