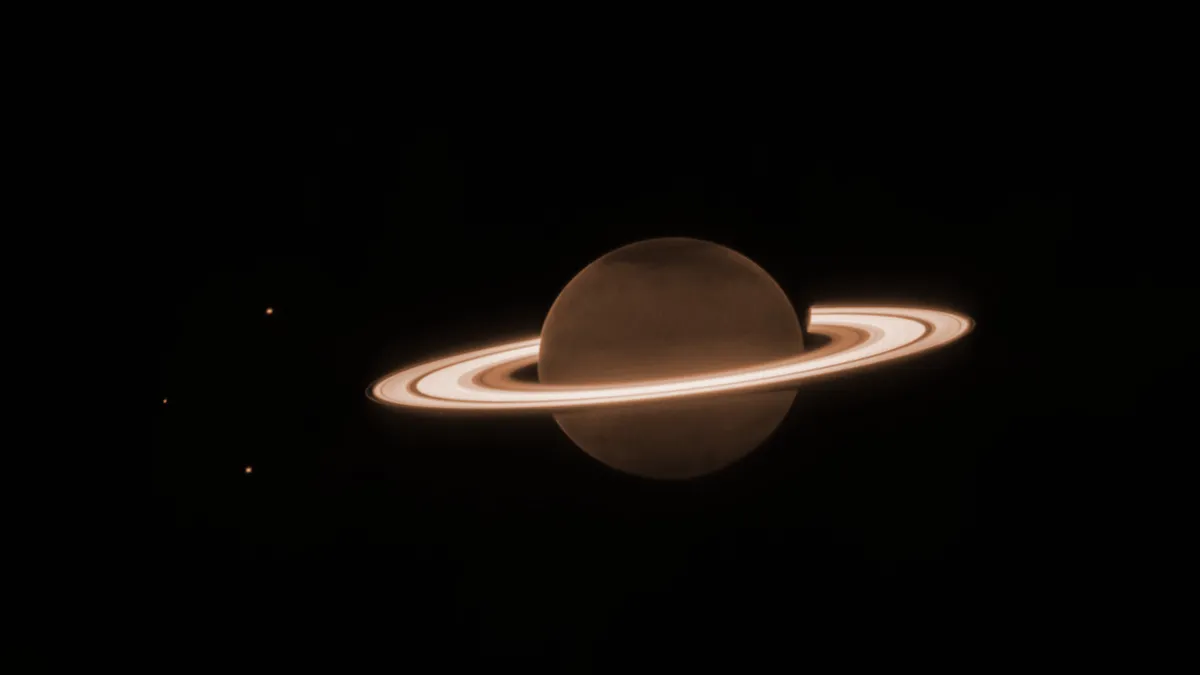
The James Webb Space Telescope, with its huge sun shield deployed like the sail of a cosmic ship, is the latest of our great explorers.
Orbiting an imaginary point a million miles away, its giant golden mirror array captures light that has been streaming across the Universe for billions of years.
How lucky are we to live in a time when we can work with this ancient light?
And not only Webb – even a decent backyard telescope is capable of producing incredible views of the cosmos.
I'm a science visuals developer at the Space Telescope Science Institute in Baltimore, Maryland, and I work on processing the James Webb Space Telescope images.
Many of the techniques I use in processing Webb data are easily transferrable to data obtained from backyard telescopes.
In this guide I'll show you some of the methods we adopt when processing Webb's images, and how you can use these for your own astrophotos.
Let’s journey through the process of working with calibrated data from any telescope, transforming it into colourful views of the cosmos.
For more info, read our guide to astrophotography and our guides to image processing and deep-sky image processing.
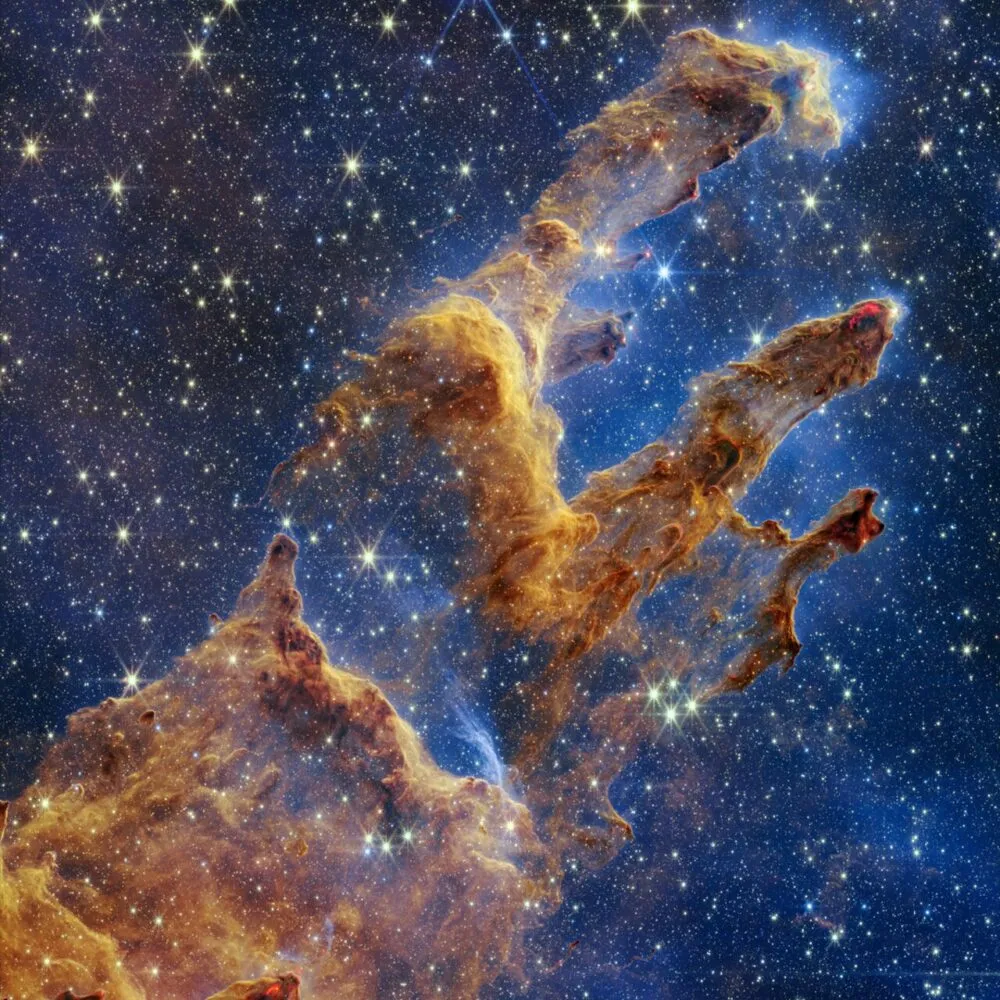
For inspiration, see the latest James Webb Space Telescope images
Data stretching
What exactly do we mean by ‘stretching’, and why do we need to do it?
Stretching here refers to the values of the individual pixels that make up the image.
Modern charge-coupled devices (CCDs) are so sensitive to light that the images they produce have an enormous dynamic range, far beyond what can be seen with the eye.
In a 16-bit monochromatic image, each pixel can be one of 65,536 different shades of grey. This specific number is directly related to the digital nature of the data.
A bit can be one of two values, 0 or 1. In a 16-bit image, each pixel holds a value defined by a sequence of 16 bits where 0000000000000000 is pure black and 1111111111111111 is pure white.
The total amount of possible values is found by taking 2 to the 16th power, or 65,536.
For simplicity, let’s consider this 2-bit image of a parrot.
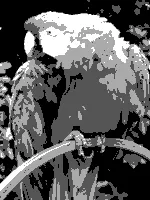
The total possible pixel values from black to white will be 2 raised to the 2nd power, or 4. With only four possible values, we can actually name them!
Each pixel can be either black, dark grey, light grey, or white. This simple image also helps us define the histogram.
Imagine if all of the pixels fell to the floor and you want to organise them by their brightness.
Each pixel can go into one of the four bins that we just defined. When you’ve accounted for all of the pixels, you’ve created a histogram!
If we want to make this image brighter, we need to change the pixel values using an image-processing application like Photoshop or the freely available GIMP.
A curves adjustment tool from one of these programs allows you to alter the values of the pixels across the entire histogram.
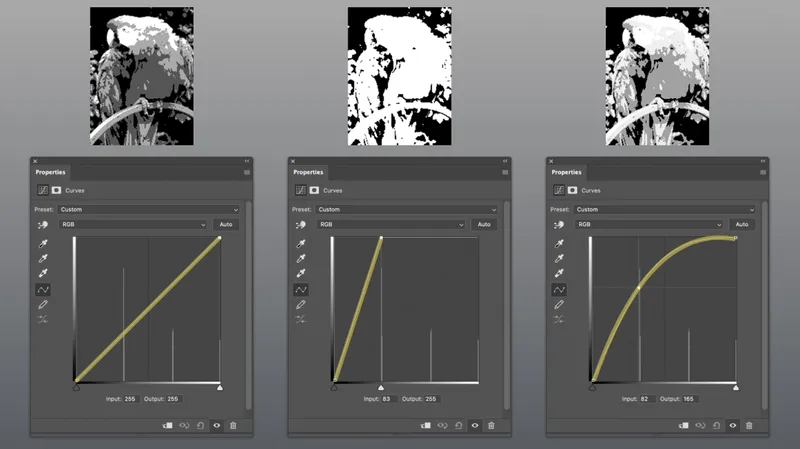
We can alter the pixels so that dark grey becomes light grey, and light grey becomes white.
This is a linear change, altering the white point of the image; while it is brighter, we’ve lost some information.
Instead, we apply a non-linear change to the pixel values, preserving the details of those white pixels while raising the light gray and dark gray pixels to a higher value.
In astronomical images we use non-linear transformations to allow us to see the faint details hiding in the darkness and preserve the bright details.
Take a spiral galaxy. You see a bright core surrounded by much fainter spiral arms of light, dotted with bright regions where stars may be forming.
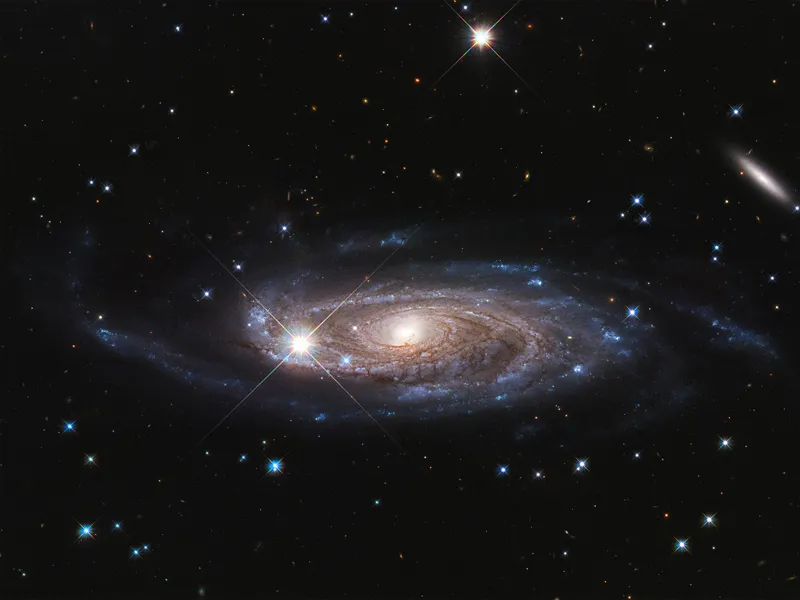
Composing an image like that requires systematically brightening the data to allow us to see those faint spiral arms and also see the bright inner core.
This is what image stretching is all about, and why it is one of the most important parts of producing a quality astronomical image.
There are many tools available for stretching astronomical data.
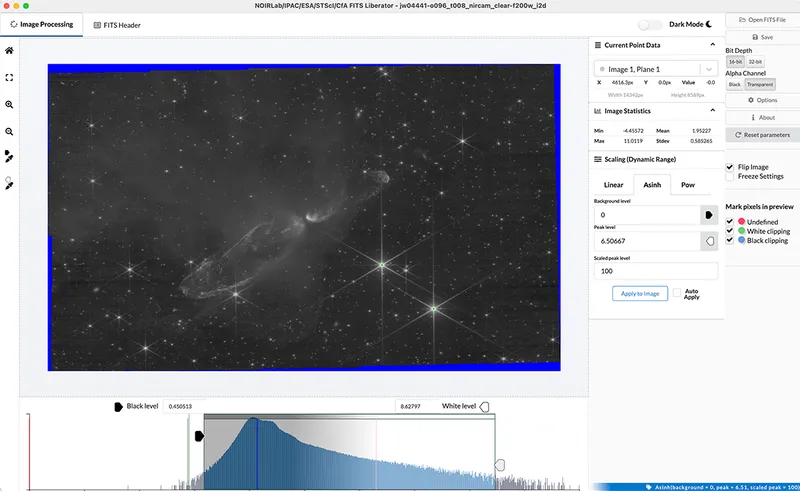
A great free option is FITS Liberator, a standalone tool that works on PC or Mac.
Its intuitive interface allows you to explore the pixel values in your image and stretch them as you see fit.
The ‘Asinh’ option under ‘Scaling (Dynamic Range)’ provides a great starting point for stretching.
Try loading your data, setting the Scaling to Asinh, then setting the ‘Scaled peak level’ to 100, ensuring that the black and white point sliders encompass the bulk of the data in the bottom histogram.
Data calibration
One of the benefits of working with data from professional observatories like Webb is that it is already fully calibrated, allowing you to jump right in at the point of composing a colour image.
If you’re working with your own telescope data, you’ll want to have those calibration steps taken care of before starting here.
However, even fully calibrated data will still contain artefacts of the imaging system like cosmic rays, reflections, uneven background levels and saturated data.
After you’ve stretched the data, you may notice these artefacts.
This is a good time to start addressing them; this cleanup work will likely continue through the following sections as well.
Example artefacts from Webb data are the black cores that we see in bright stars, which are actually a result of the calibration process flagging saturated pixels.
I deal with this issue using an adapted script in PixInsight (available here: bit.ly/PixelClipJDP) which replaces those black pixels with surrounding white pixels.
A similar result could be achieved through the use of the ‘Color Range’ selection tool in Photoshop, carefully set to flag pixels below a certain threshold and then set them to white.
Working with colour
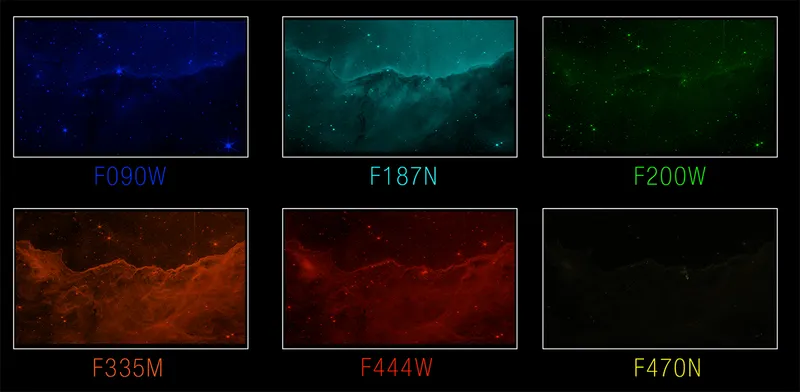
Colour in astronomical images comes from the use of filters when obtaining the data.
Filters separate the light we’re observing into very specific wavelength ranges.
Even the cameras in our cell phones use filters to produce colour images, but those filters are usually built into the pixels so we never see them.
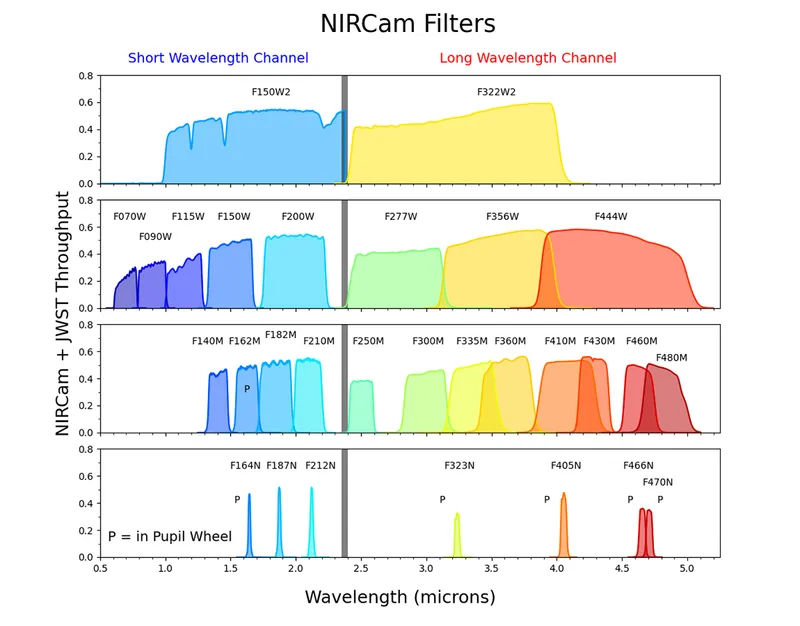
Webb’s NIRCam instrument has 29 bandpass filters, providing astronomers with an array of options for capturing their data.
Similarly, cameras developed for ground-based astrophotography use filters to provide the necessary data for a colour image.
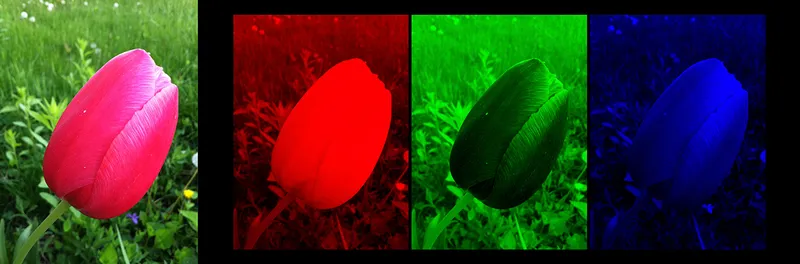
A basic colour image would be composed from three wideband filters, combining light from a red filter with light from green and blue filters.
The data is grayscale, so colour is applied in an image-processing application and we use a chromatic ordering to apply colours systematically.
In the case of R G and B filters, this is very straightforward.
Chromatically ordering the data means that we apply colour according to wavelength, with the longest wavelength being assigned red, the medium wavelength green and the shortest wavelength blue.
We use this same approach with Webb data, even though the light captured by Webb is infrared.
I apply colour either in PixInsight with the use of the PixelMath tool or in Photoshop using adjustment layers.
You could also try using GIMP to apply colour to astronomical data.
As you’re combining data in colour, watch out for any calibration issues like cosmic rays.
They can be dealt with by finding the offending pixels and replacing them with the average value of nearby pixels, being careful not to add or remove anything that wasn’t already there in the data.
Colour balancing and image composition
Congratulations on making it this far into the process!
By now, you’ve found the best stretch for your data and applied colour chromatically.
You could stop here, but you would be missing out on some very important steps in this process.
Colour balancing and tonally adjusting your image can turn your image into something truly spectacular.
Not all filters allow the equivalent amount of light to pass through, so we need to balance the filter contributions in the final composite image to avoid any colour imbalances.
At the very least, you’ll want to make sure that the blank sky background of your image is roughly a neutral dark grey.
If your image contains face-on spiral galaxies, they make an excellent white reference point.
This can be done in PixInsight using the ‘ColorCalibration’ tool or in Photoshop using curves adjustment layers.
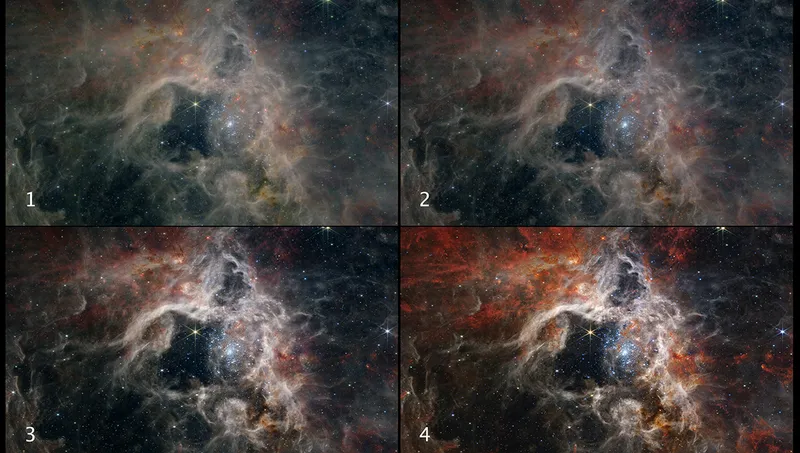
Once content with your colour balance, you can make some final tonal adjustments, again using curves, with an eye towards obtaining a good overall contrast across the image.
I prefer my blank sky background to be slightly above absolute black, and I make sure that the brightest parts of my image are pure white without being overly saturated.
Finally, consider the composition of your image.
Does it roughly follow the rule of thirds?
Are there leading lines that may guide the eye towards different features?
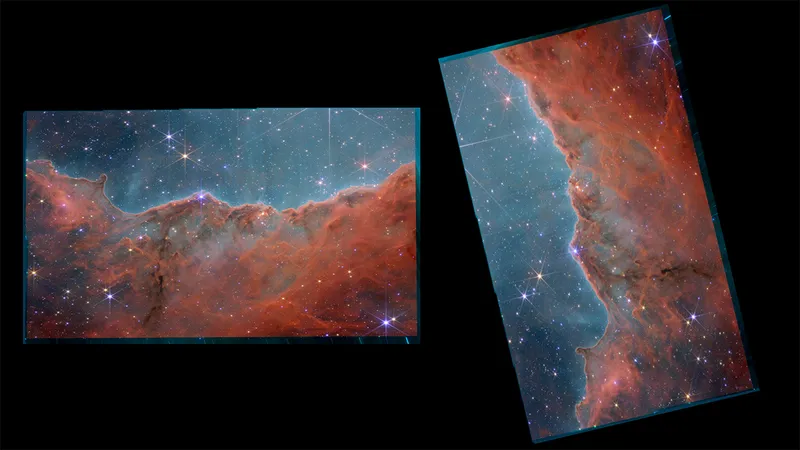
If not, can you reorient through cropping and/or rotation to make a stronger image?
There is no up or down in space, and you’re not obliged to adhere to the scientific standard of north = up, east = left.
Of course, for well-known objects you may want to stick with the standard orientation for ease of recognition, but you be the judge of what will make your image visually strongest.
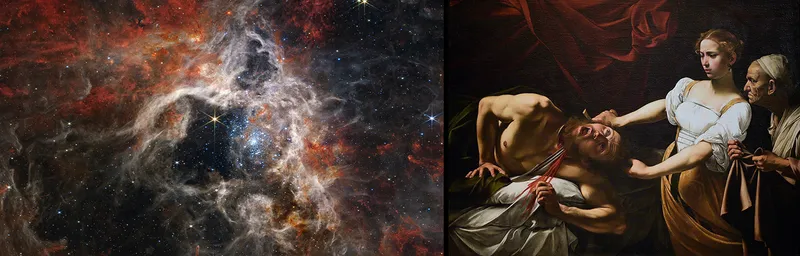
I sometimes draw inspiration from Old Masters paintings or landscape photography.
There’s a reason these paintings and photos have withstood the test of time – they appeal to our visual instincts, and we would do well to learn their aesthetic lessons.
Conclusions
Our journey together ends here, but yours is just beginning!
I hope this has given you the guidance you need to take your own data to the next level.
Despite the drastic differences in the technology of JWST versus a backyard telescope, we can apply the same principles of image processing.
As 21st-century explorers of the cosmos, our oceans are the seemingly infinite pixels beamed back to us by our instruments.
Navigating those pixels and finding the details buried in the darkness is our charge.
Go forth and discover, and as always, clear skies!
Are you an astrophotographer? Don't forget to send us your images!
This guide appeared in the November 2023 issue of BBC Sky at Night Magazine.
