A casual look at the night sky gives the impression that the stars are constant and unchanging. While it’s true that many stars remain fairly constant over the course of a human lifetime, there’s a large number of stars that change quite rapidly, sometimes in a matter of hours.
The ancient Egyptians knew that the star Algol (Beta (β) Persei) in Perseus changed in brightness, but it wasn’t until 1638 when Johannes Holwarda discovered that the apparent magnitude of the red giant star Mira (Omicron (ο) Ceti) in the constellation of Cetus, the Whale varied over a period of about
11 months.
Eventually, other stars with similar behaviour were discovered and, before long, a new area of astronomy arrived: the study of variable stars.
Why study variable stars?
Today, variable stars play an important role in stellar astrophysics – they provide an essential laboratory in which we can test our models of stellar evolution, from bloated red giants at the end of their lives to binary stars caught in fatal gravitational ballets.
Nevertheless, variable star observing is straightforward and surprisingly rewarding. It requires little more than binoculars or a small telescope, some charts and a notebook.
Why do stars vary?

Fundamentally, there are two types of variable stars: intrinsic variables and extrinsic variables.
Intrinsic variables are stars whose changes in magnitude are caused by physical processes within the star itself.
For example, many red giants (such as Betelgeuse (Alpha (α) Orionis) or Mira) shrink and expand over a period of months – as the surface of the star expands, they become fainter; when it contracts it becomes brighter.
Eruptive variables are the result of violent changes on the surface of the star: large flare activity, for instance, can cause a star to brighten by six magnitudes. More dramatic examples include the novae and supernovae.

Extrinsic variables vary due to physical interactions with a nearby companion star. For example, the red giant star SS Cygni has a white dwarf companion that pulls material off the main star.
This material forms an accretion disc and over time, instabilities in the disc change its viscosity, which alters the temperature and allows more material to be compacted into the disc.
The end result is that the accretion disc can become very bright – it’s capable of going from mag. +12.0 to mag. +8.0 in a just few days.
This system is an example of a dwarf nova (quite different from a supernova, which is a supermassive star’s final moments).
In contrast, Algol varies in brightness due to its companion passing in front of and behind the star, which makes it an eclipsing binary system.
When setting out to observe variable stars, the first thing you need to do is to choose some.
It’s a good idea to start with some variables that are easy to locate. See further down for 5 good variable stars worth observing
Some need to be observed more frequently than others. Pulsating Mira-type stars should only be observed once a week (as their changes are slow), while eruptive or dwarf novae can be observed on any clear night.
Variable star observing is ideal for observers with binoculars or small telescopes.

In fact, you shouldn’t use anything larger than a 4-inch (102mm) telescope for objects brighter than the 8th magnitude. Also be careful of bias; red giants can appear brighter than they actually are.
To begin your observations you’ll need to print off a suitable variable star chart (more on this below)
Seeing conditions aren’t too important for variable stars, but you’ll want the sky to be free of haze and to avoid observing in strong moonlight.
It’s a good idea to record your observations in an astronomical logbook – record the date, time (in UT – Universal Time), your magnitude estimate and the chart sequence. You should also record the size and type of telescope used.

Once you have the variable star in the field of your telescope or binoculars, you’ll need to estimate its brightness.
Don’t rush this – it’s really important that you identify the variable star in the field, so spend time checking that the stars in the field of view match up with those on your chart.
It’s probably best to use a low-power eyepiece to begin with. This should allow you to match the stars you can see with those on your chart.
When you’ve located and confirmed your variable, find a suitable comparison star (ideally of similar brightness) and record how much brighter or fainter the variable is compared to it.
The Pogson step method is good way to do this. You estimate the magnitude of a variable star with the help of a comparison star, using steps of 0.1 of a magnitude.
So if your comparison star is mag. +10.3 and you think the variable is four-tenths brighter, you’d record it as ‘103 – 4’.

This notation means that the comparison star is of mag. +10.3 and that you estimate the variable to be about four-tenths brighter (by convention, you exclude the decimal point).
Based on this estimate, the variable has a magnitude of +9.9, as mag. +9.9 is 0.4 times brighter than mag. +10.3.
If instead the variable was about six-tenths fainter, you’d record ‘103+6’ and the deduced magnitude would be +10.9.
You can repeat this with other comparison stars in the field to get two or three estimates and then take an average.
You can find more detailed explanations of the Pogson step method on the American Association of Variable Star Observers (AAVSO) and the British Astronomical Association websites.
Plotting a light curve

Repeating your observations over time will give you a series of magnitudes for the variable star and when you plot these on a graph (with dates on the horizontal axis and apparent magnitudes on the vertical) the result is called a light curve.
These are unique to each star, although similar types of variables have similar light curves.
This is the main aim of variable star observation and the more observers that contribute magnitudes for a given star, the more accurate the light curves become.
You can plot light curves from your observations on the AAVSO or the BAA websites.
The light curve is key to understanding a variable’s behaviour. From this, we can determine how frequently the star is varying (its period), and the long-term study of light curves often provides hints of other astrophysical processes that may be at work.

From the light curve of SS Cygni we know that there are two types of brightening, one that lasts less than 12 days and others that last a lot longer.
It’s not uncommon for variables to throw up some surprises. They may get brighter or fainter than
usual (Betelgeuse for example).
Alternatively, they might remain quiescent for unusually long periods of time (the star R Coronae Borealis experienced an unusually long period where it was very faint, dipping below mag. +14. At the time of writing it’s about mag. +6.0).
All this tells astronomers that something interesting is going on and adds to our theories of stellar evolution, or our understanding of accretion theory.

Finally, it’s really important to report your observations to the Variable Star Section of the BAA or the AAVSO. Both organisations allow you to enter your observations via an online form.
The BAA in particular has been collecting amateur observations of variable stars since 1890 and has a number of pro-am collaborations.
Your long-term observations of variable stars are part of an invaluable resource – most professional telescopes are engaged in large fundamental observing campaigns, and it would be quite impossible to use them for long-term measurements of the many thousands of variable stars known to exist.
By observing and recording variables, you’ll be contributing to the only long-term narrative professional astronomers have of these objects, and doing so will help us answer the many questions that remain regarding the private lives of these stars.
Equipment for observing variable stars
Red light
An essential bit of kit! White light will destroy your night vision and distort your magnitude estimates. Your eyes must be dark adapted when you’re observing variables.
Read our DIY guide to make your own red light torch.
Binoculars or a small telescope
There are a few naked-eye variables, but many hundreds are in the range of binoculars or a small telescope. A selection of low- to medium-power eyepieces is also useful.
Comparison charts
It’s essential that the correct star charts are used for magnitude estimates. You can get charts from the British Astronomical Association or the American Association of Variable Star Observers.
The charts provided by these organisations have carefully chosen comparison stars listed. Each chart has its own name (called a chart sequence).
Magnitudes of the comparison stars on AAVSO charts have no decimal point (which could be confused as a star), while the magnitudes of stars on BAA charts are given by letters to prevent bias.
A notebook
You’ll need to keep a record of your magnitude estimates for each variable star you observe.
You should include: the name of the variable star, the date, time (in Universal Time), the chart sequence of the chart containing your comparison stars, your estimate and the deduced magnitude of your star.
A laminator
Laminating your charts will protect them against dew and save you from printing a new chart every clear night.
Online resources
Check out the BAA and AAVSO. Both organisations allow you to download charts and generate light curves. There’s help with different aspects of variable star observing, and you can upload your observations as you make them.
5 variable stars to seek out
1
SS Cygni
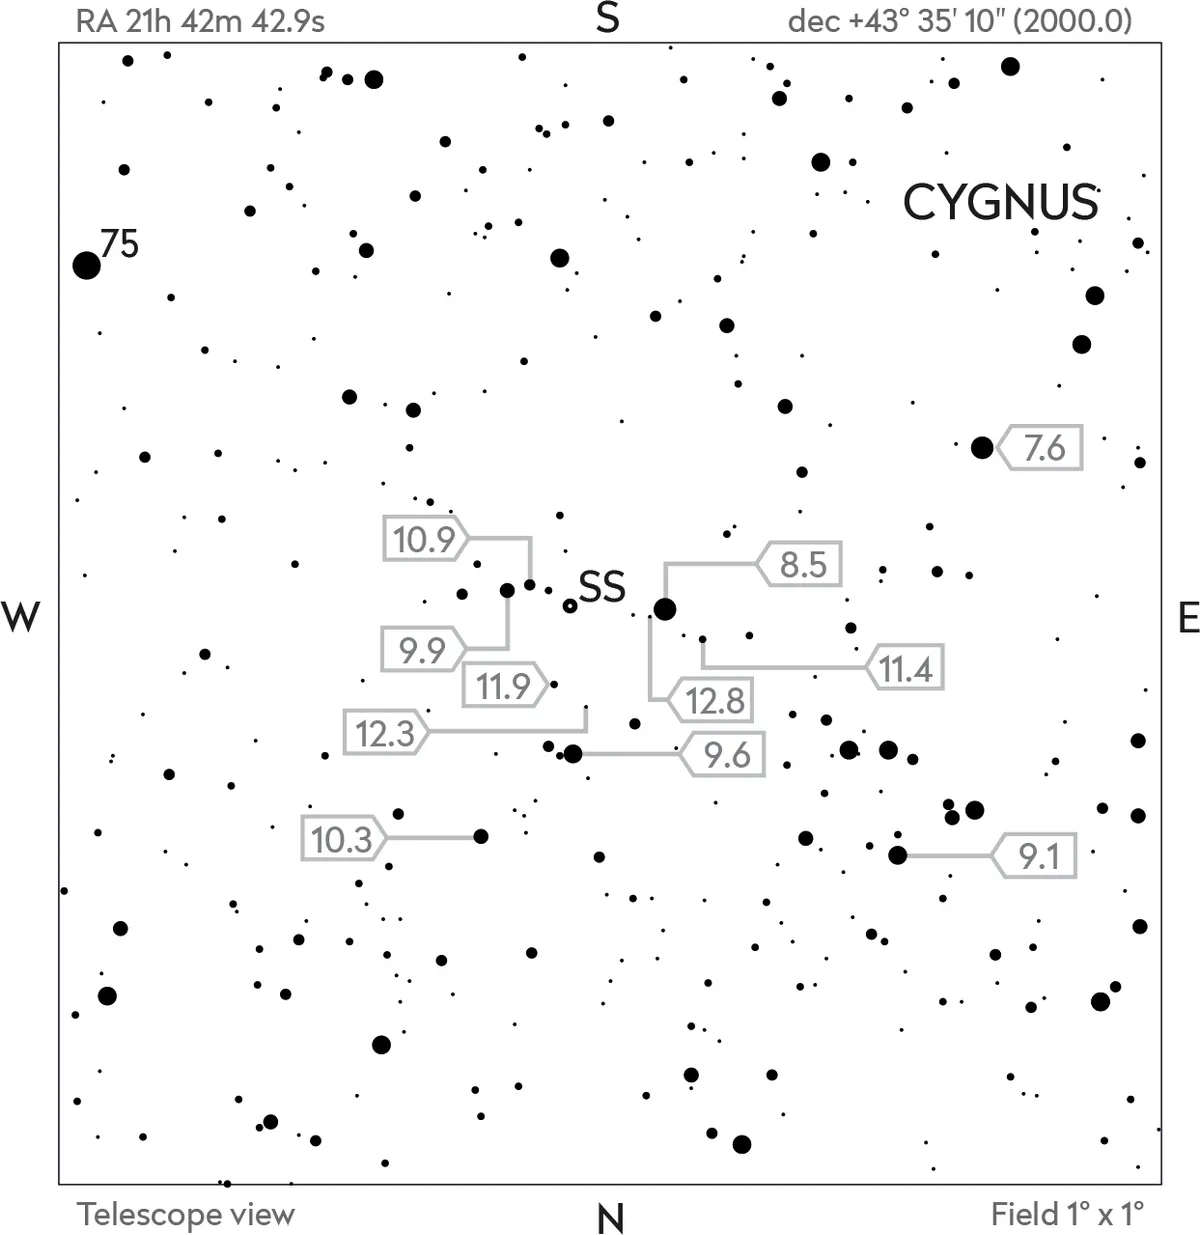
SS Cygni is a dwarf novae that resides in the constellation of Cygnus, the Swan, not far from the nice double star 75 Cygni.
When it’s quiescent (in a state of inactivity), the star is approximately mag. +12.0, but during an outburst it can brighten to about mag. +8.0.
SS Cygni undergoes these outbursts every 7 to eight 8, so should be checked out whenever there’s a clear night.
2
Chi Cygni
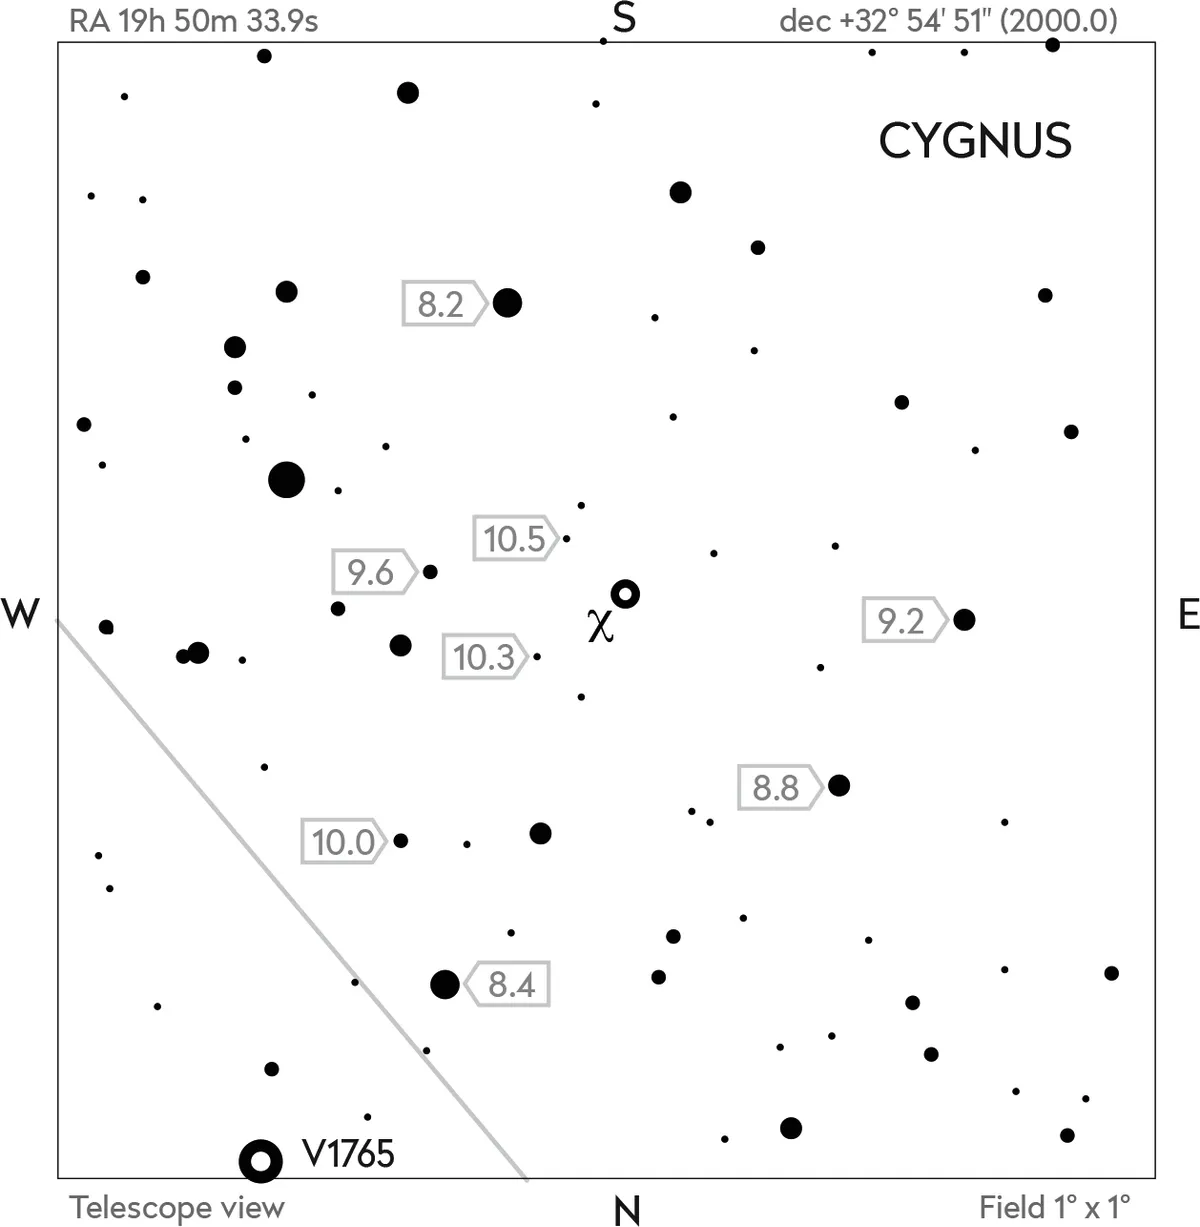
Located fairly close to Eta (e) Cygni at the base of the ‘Northern Cross’ asterism in Cygnus, Chi (c) Cygni is a splendid red giant of the Mira type.
Over a period of about 400 days, Chi Cygni can get as bright as mag. +3.5, before fading down to a minimum around mag. +14. Chi Cygni is throwing off material into space, material that will eventually form a planetary nebula. Aim to observe this star once a week, if possible.
3
Algol
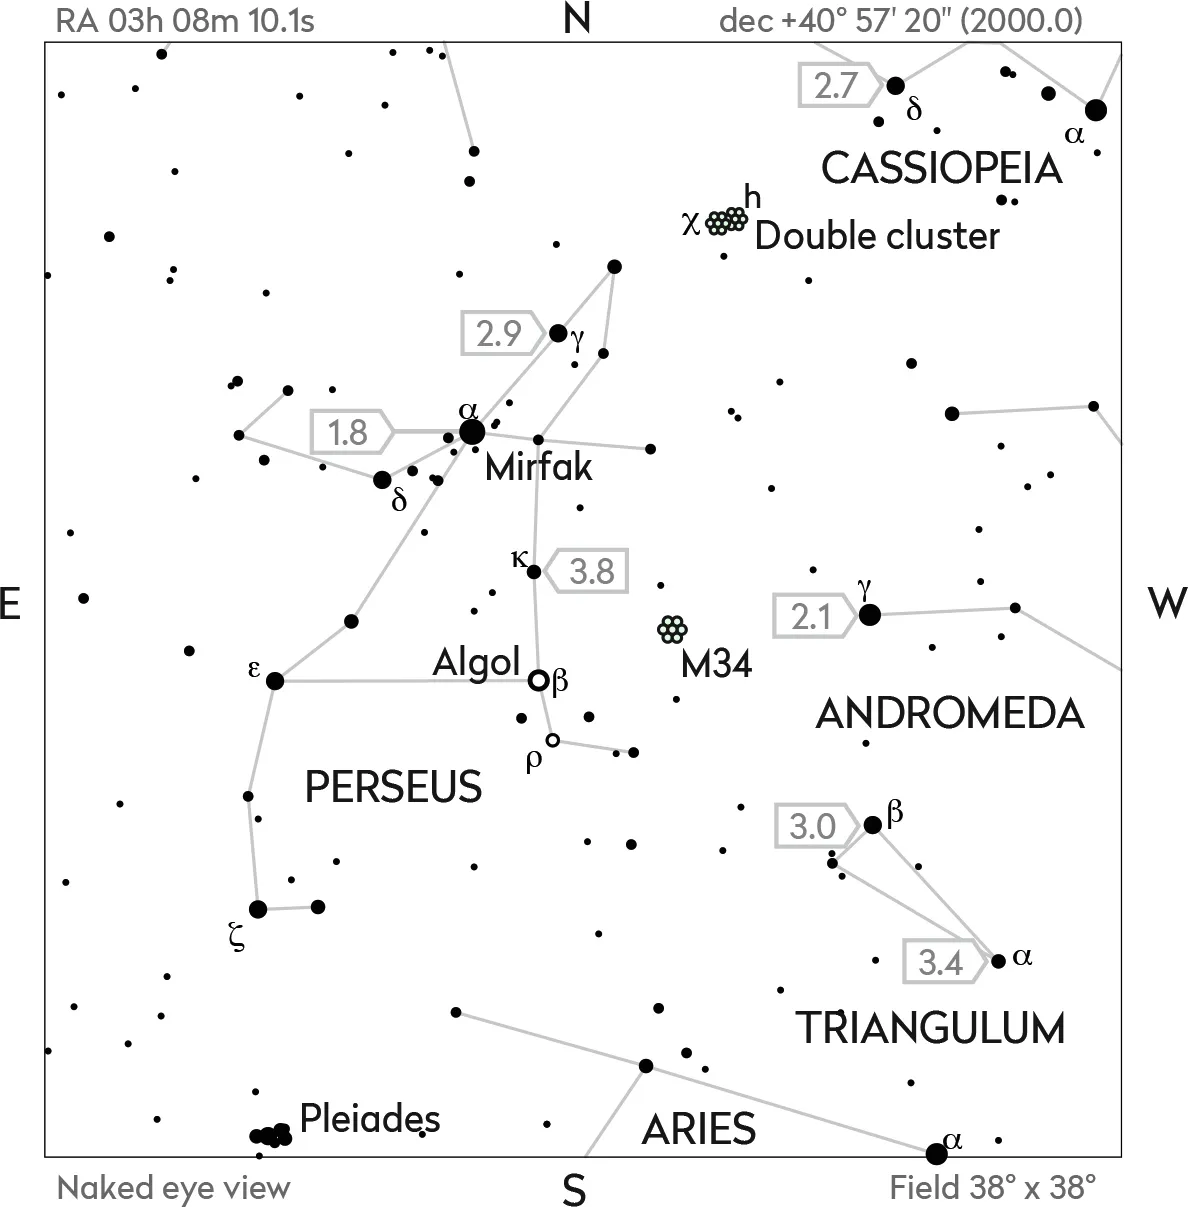
This is an example of an eclipsing binary system – Algol (Beta (b) Persei) is, in fact, composed of three stars: Beta Persei Aa1, Beta Persei Aa2 and the fainter Beta Persei Ab.
It’s the two hot primary stars, Beta Persei Aa1 and Beta Persei Aa2, that eclipse each other and these eclipses take approximately 10 hours.
Algol is usually around mag. +2.1, but every 2.9 days it drops to mag. +3.4. Try to observe it each clear night.
4
V Bootis
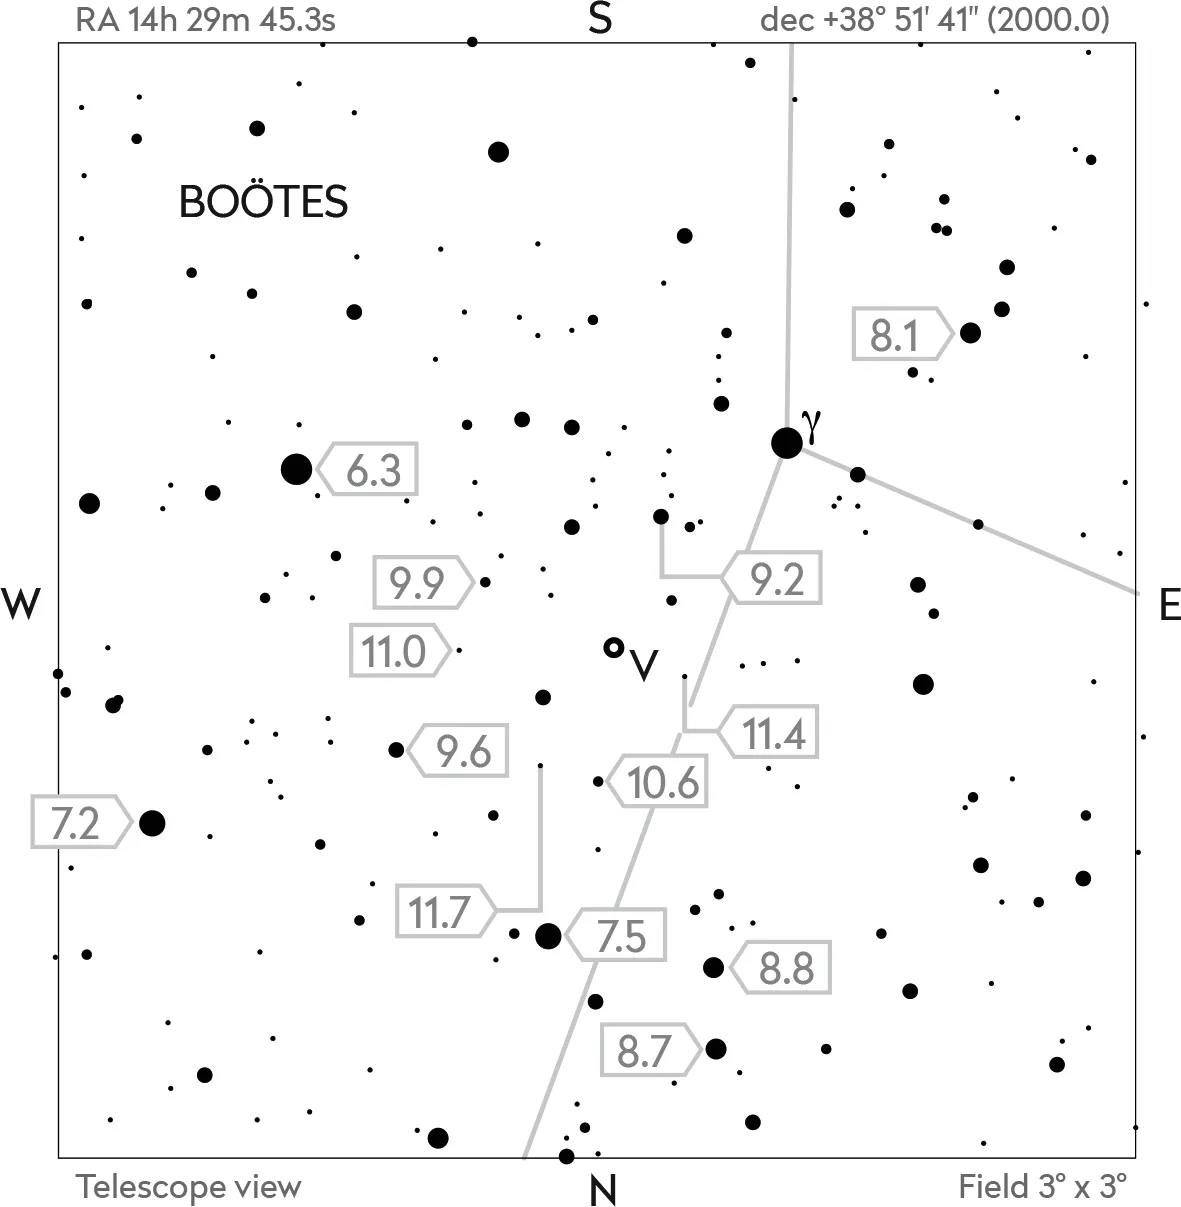
Another beautiful red giant, in Boötes, the Herdsman, close to Seginus (Gamma (γ) Boötes).This star ranges from around mag. +7.0 to mag. +12.0 over a period of 258 days.
Studies of the light curve suggest that there’s a secondary period of about 137 days, and during the early part of the 20th century the overall light curve was somewhat different (the star could be evolving away from being a Mira-type star). Aim to observe it once a week.
5
R Scuti
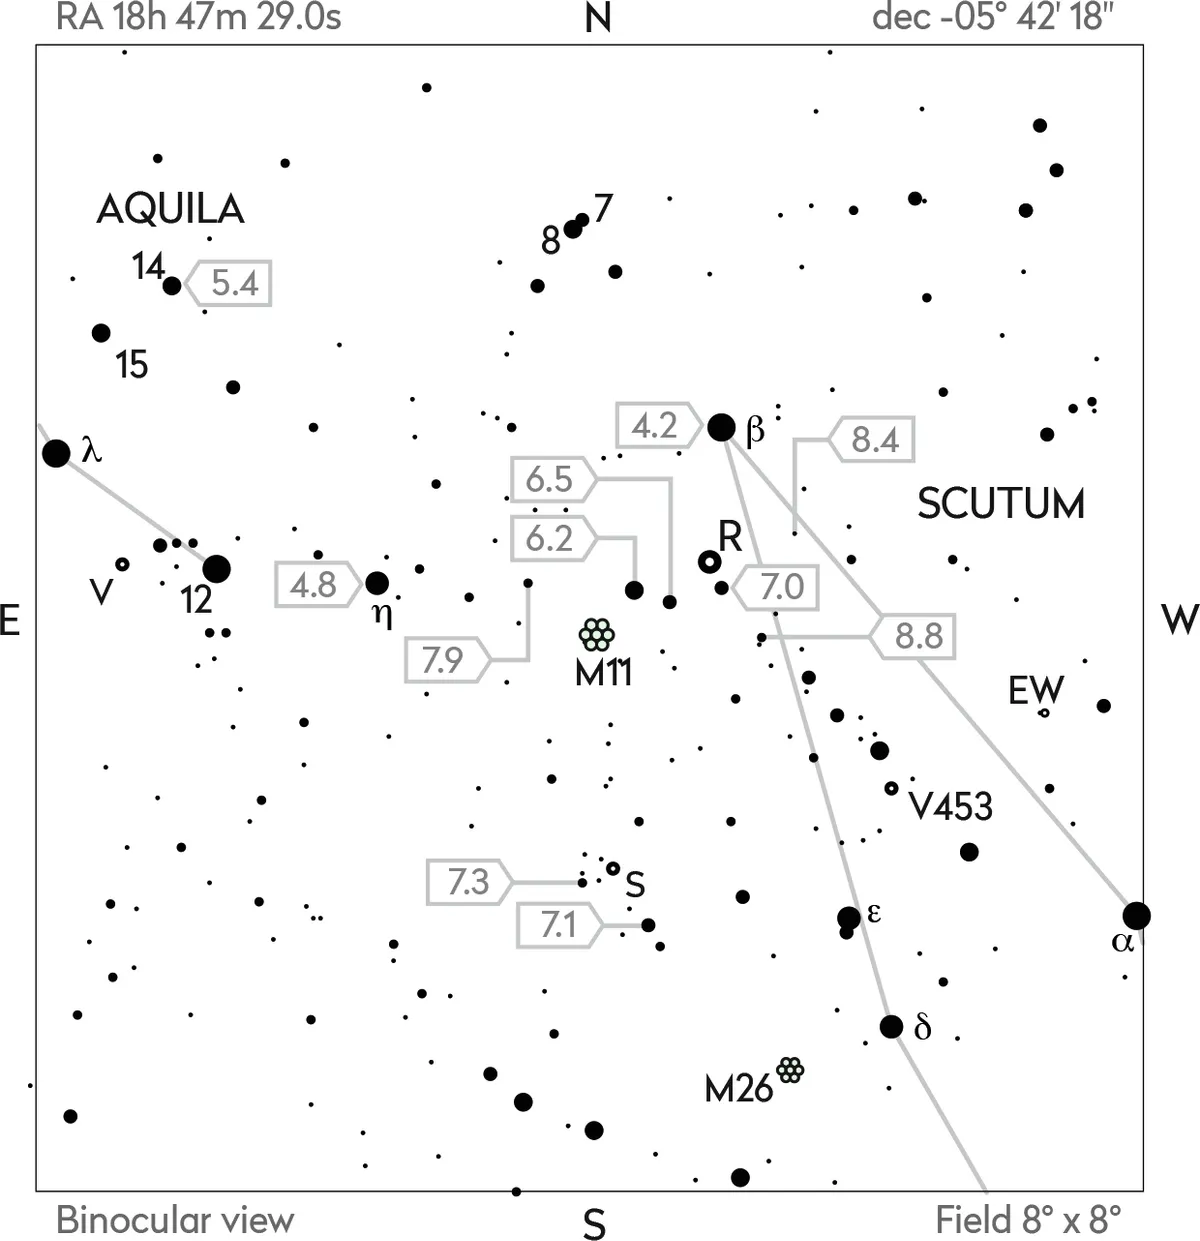
This yellow supergiant star is an example of a RV Tauri variable. It lies close to both Beta (β) Scuti and the splendid Wild Duck Cluster, M11.
The light curve for this star is quite remarkable and shows periods of deep minima and unusual ‘stand-stills’, during which its magnitude is constant for long periods of time.
It’s thought that the dynamics of the star are responsible, but there are many questions yet to be answered. Observe this star every chance you get.
Beware of bias
Words: Grant Poyner
The nature of the star is an important factor to take into consideration when you attempt to put together an observing programme of variable stars.
The slow variation of Mira stars, for example, need not be observed more than three times a month – perfect if you can only manage the odd night here and there to observe.
Eruptive and cataclysmic stars, however, need to be monitored on a nightly basis, which takes a little more dedication.
Bias is a major problem to both inexperienced and experienced observers alike, and it’s important not to over-observe a variable.
A star that varies over a period of 400 days will change in brightness very slowly indeed, so any change in its magnitude is not likely to be noticed on consecutive nights.
However, the memory of the observation made a night earlier will still be fresh in your mind and will be difficult to ignore.
Plan your observing sessions around the period of the stars you are observing.
Choosing the correct star to observe with your chosen instrument is another important consideration.
A 6-inch (15cm) reflector will not show you a ‘dwarf nova’ in outburst if its magnitude range is +15.0 to +18.0.
Likewise, a 12-inch (30cm) reflector is really too large an instrument for the RV Tauri-type star R Scuti, which varies between magnitude +4.2 and +8.6.
Choose your stars carefully and build your programme around the magnitude limits of your telescope or binoculars.
To inexperienced observers, the prospect of measuring the magnitude of a star to a few tenths of a magnitude may seem daunting, but providing a few procedures are followed accurately, it is straightforward.
The first thing that is required is an accurate variable-star chart.
Magnitudes taken from commercial planetarium software can sometimes lead to inconsistent results when the data is analysed and compared with official charts.
To make the observation, compare the brightness of the variable to two or more of the comparison stars on the chart – one fainter and one brighter.
Two methods are in common use, the Fractional and the Pogson Step method, the former being more suited to beginners.
The Pogson Step is recommended for those who have some experience in this type of observing, as it requires the eye to recognise differences of one tenth of a magnitude.
The fractional method simply requires the brightness of the variable to be expressed as a fraction of the difference between two comparison-star magnitudes.
There are several hurdles to overcome before a confident observation can be made.
Correctly identifying the variable itself is the most common problem faced by the newcomer.
The Purkinje Effect – the shift of the eye’s peak sensitivity towards the blue end of the spectrum at low light levels and its consequences on red stars – is another.
However, the satisfaction of developing a light curve over weeks or months more than makes up for all the preparation that has gone on before.
In our star-hopping guide to observing T Cephei we take a look at how to observe the Mira-type star T Cephei.
It has a range of magnitude from +5.2 to +11.3 over a period of 388 days, it’s circumpolar from the UK and is due at maximum brightness during early November 2005.