Newly-released images from NASA's Solar Dynamics Observatory reveal activity on the Sun in different wavelengths, with coronal holes, coronal mass ejections and solar flares all visible.
Solar activity peaks and troughs in an 11-year pattern called the 'solar cycle', whereby the Sun quietens down before an increase of phenomena is observed as the peak of the cycle approaches.
After years of quiet, solar astronomers announced recently that Solar Cycle 25 has begun.

As the images from NASA's Solar Dynamics Observatory (SDO) below show, there is currently much to observe on the Sun, with all manner of solar phenomena on display.
The SDO spacecraft launched on 11 February 2010 into an Earth orbit to study solar activity and so-called space weather.
Measurements of the Sun's magnetic field, its interior and the stream of charged particles known as the 'solar wind' all help scientists understand the star at the centre of the Solar System and its effect on the orbiting planets - including our own planet Earth.
SDO observes the Sun in different wavelengths beyond what the human eye can see to provide a deeper understanding of what's going on at the surface, and below.
These images of the Sun were all captured on 29 January 2021 at around 09:30 UTC.

At a wavelength of 193 angstroms, SDO can observe the outer atmosphere of the Sun, known as the corona.
Bright areas indicate hot active regions, solar flares and coronal mass ejections (CMEs), which are energetic ejections of plasma that can erupt into space as fast as 3,000 km per second.
CMEs occur when magnetic field structures in the corona realign and generate a sudden burst of electromagnetic energy.

At 211 angstroms, this SDO image shows coronal holes as dark areas, while active regions, solar flares and CMEs appear bright.
Coronal holes are regions where very little radiation is emitted by the Sun, which is why they appear darker.
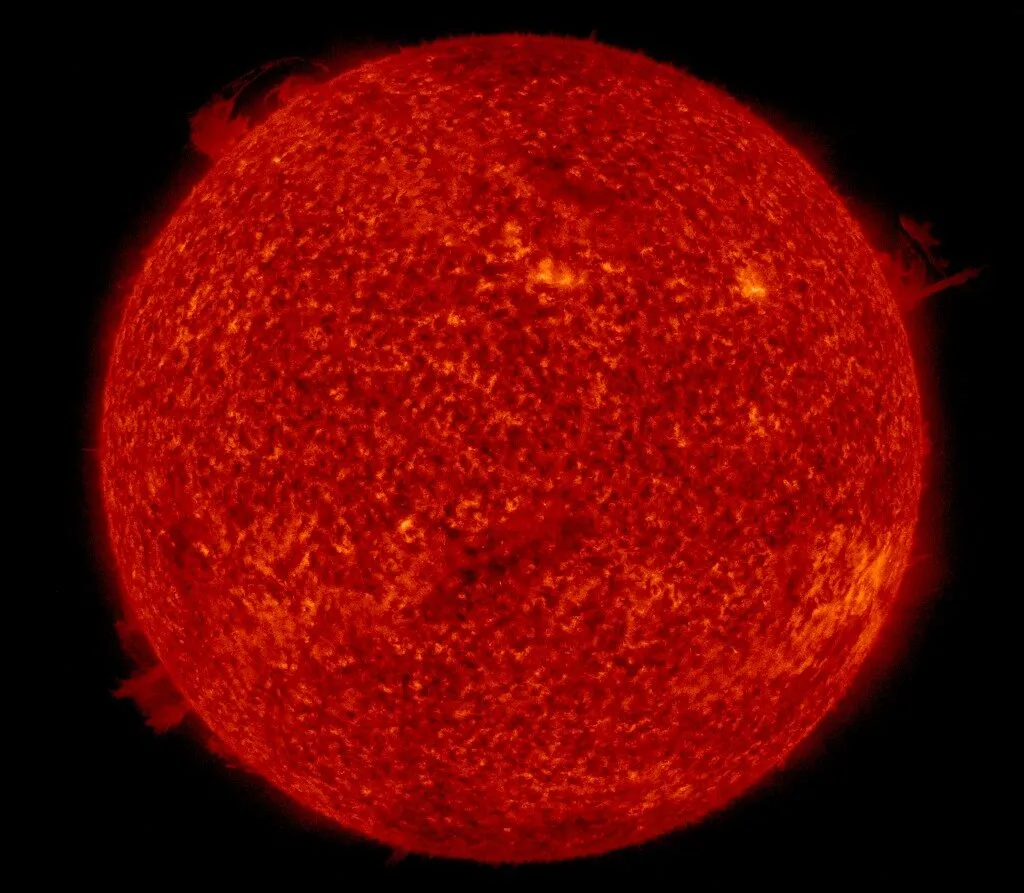
This channel - detecting at 304 angstroms, shows features known as filaments and prominences protruding above the visible surface of the Sun. Bright areas are regions where solar plasma has high density.
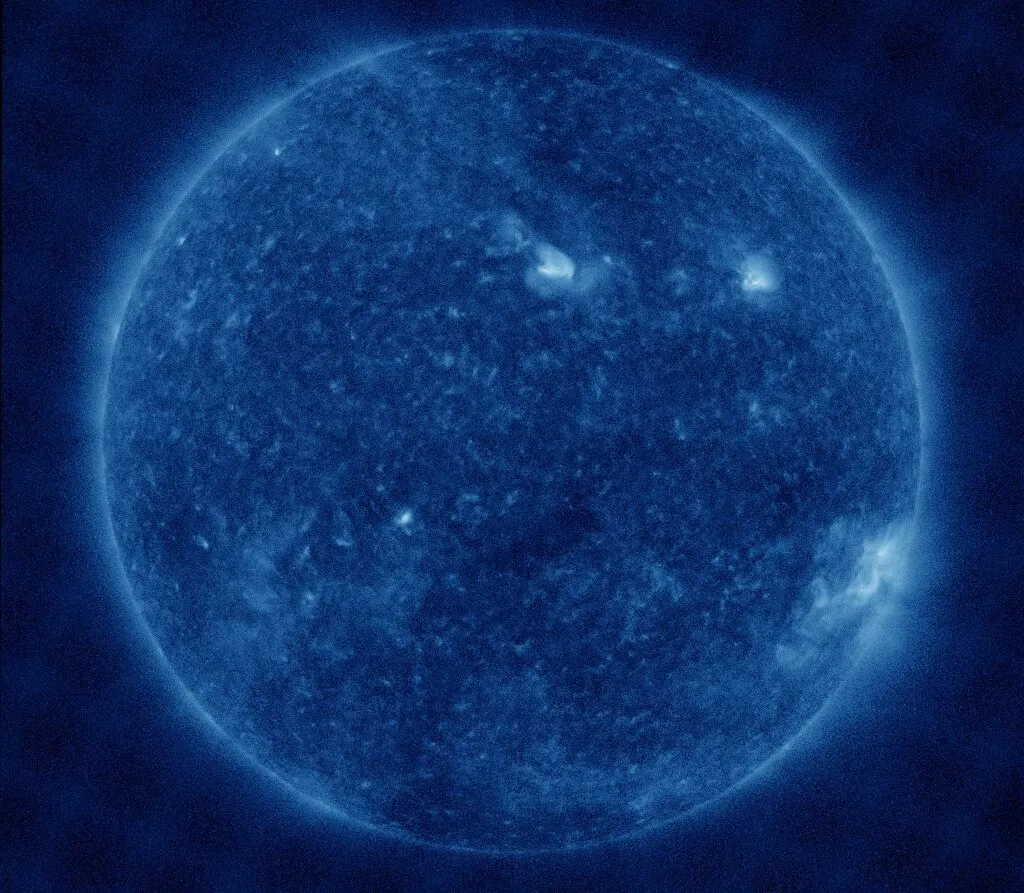
At 335 angstroms, active regions like solar flares and CMEs can be seen as bright regions, while dark areas indicate coronal holes.
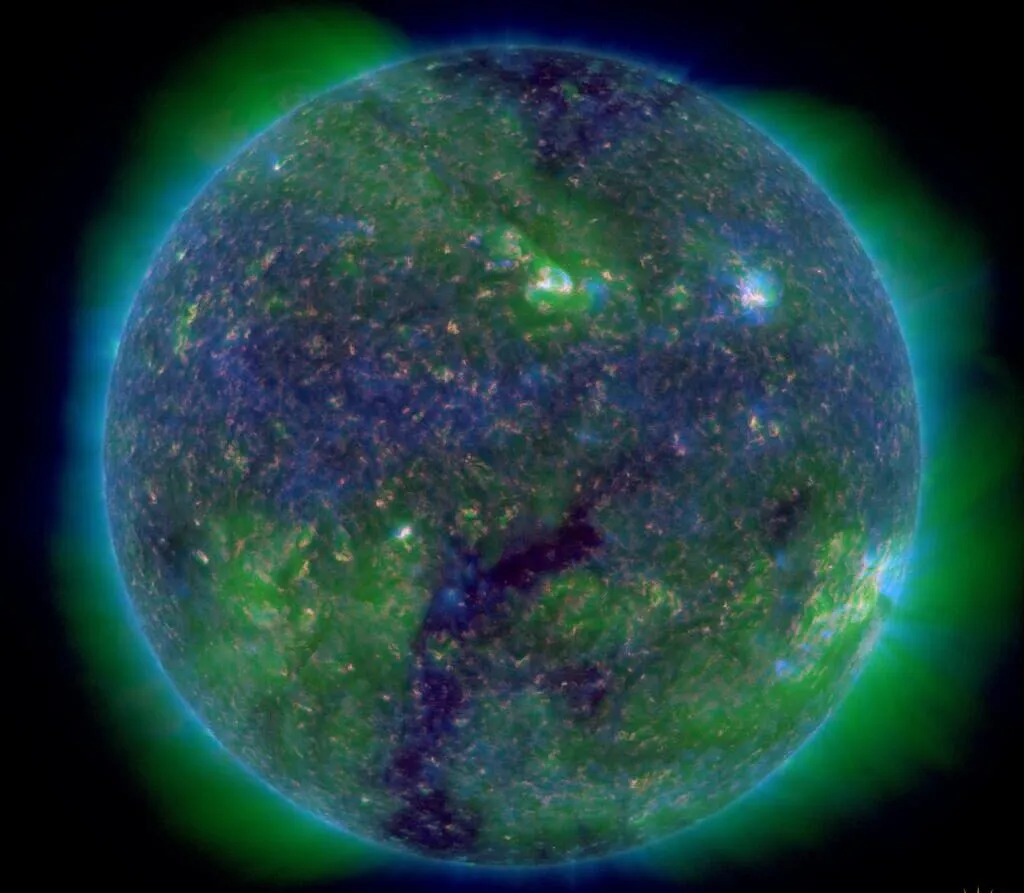
This composite image shows the Sun viewed at different wavelengths. 304 is seen as red and shows the chromosphere, 211 in green shows the corona, and 171 in dark blue also shows the corona.
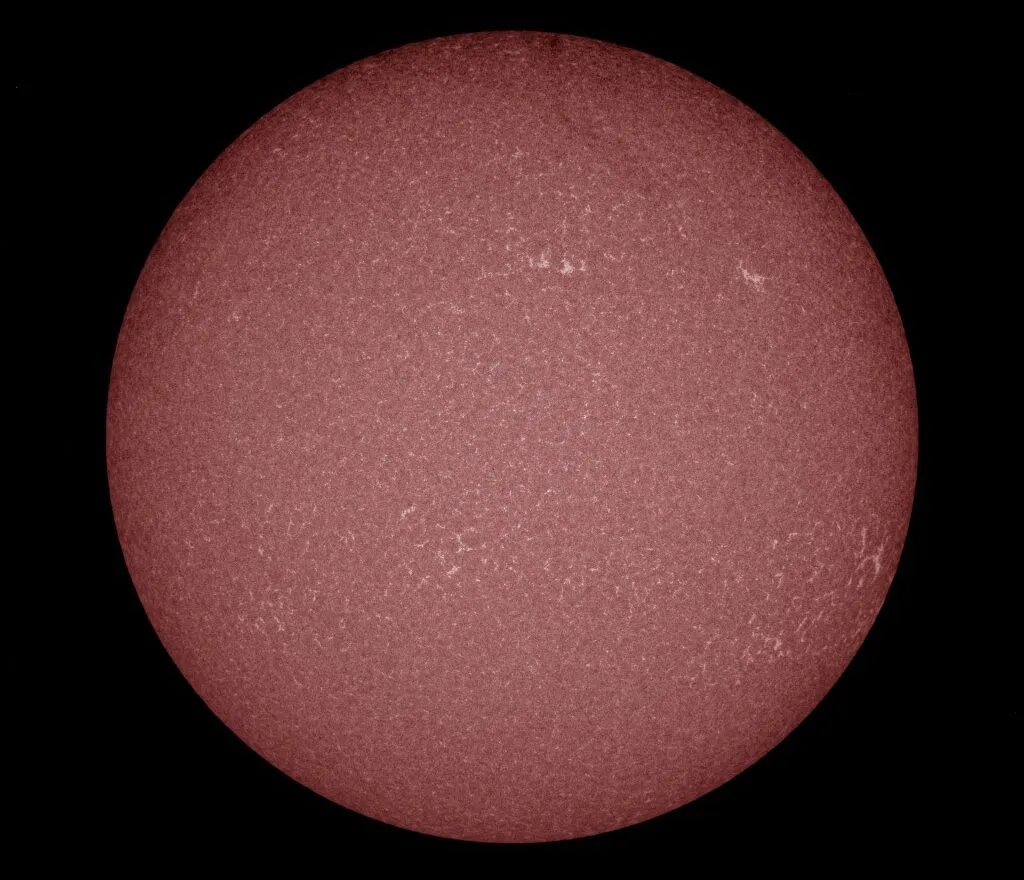
At 1,700 angstroms a web-like pattern of concentrated magnetic fields lines can be clearly seen. Regions with a lot of field lines appear black.
For more info on the SDO, visit the Solar Dynamics Observatory website.
