Amateur astronomers can make valuable contributions to solar science through their observations and images of the Sun. You may be an expert in solar photography, or perhaps you already know how to observe the Sun and it's your favourite niche of practical astronomy. But have you ever thought about using your skills to help citizen science?
There are many spacecraft and other missions dedicated to the study of the Sun, but in this article we'll show how your own observations of the Sun can be of real use to solar scientists by noting the features on its dynamic surface and logging how they change over time.
Remember, you should never look at the Sun directly without proper, certified equipment that enables you to do so safely.
Make sure to always record the date and time of you observations of the Sun along with the observer name, location and equipment.
A value called the Carrington Rotation number is another useful piece of info to add. You can find this from various sources, including some of the useful solar observing and imaging software listed below:
Get into the habit of adding this observing information directly onto each image, either as an overlay or in a specifically created area. And as ever with the Sun, only view or image it through certified solar filters.
If you're all set and ready to do some real, scientifically valuable observing and imaging of the Sun, get stuck in to our three projects below and play your own vital part in solar science.
How to count sunspots

Using a white light filtered telescope to count sunspots, you can calculate your relative sunspot number Rp. This helps astronomers gauge solar activity.
- Rp is calculated using the formula Rp = 10g + f.
In this, g is the number of active regions (sunspot groups) and f the number of sunspots. The official sunspot number (R) equals k(10g + f) where k is a value unique to you, your location and your telescope.
Your k can be determined by comparing Rp with the published value at Sunspot Number of R over several days and averaging the result. But when you submit data you simply use Rp.
An active region is distinct from another if it is separated by more than 10º. Large active regions may expand over 10º, split and contain parts more than 10º apart.
These are counted as two groups. When carrying out a count, determine the number of groups first then the number of spots.

Pores and light areas of penumbra should not be counted. Spots in a common penumbra count individually, as long as they are not joined.
You can refine this by differentiating between solar hemispheres using g = gn + gs, where gs is the southern hemisphere group count, and gn the northern.
Similarly for spots, f = fn + fs, where fn equals the spot count in the northern hemisphere, fs the count in the southern.
Determining the heliocentric latitude and longitude accurately helps in working out the split. This can be done with either a grid overlay (see Project 3) or interactively with programs like WinJupos (see Project 2).
As well as active regions and sunspot groups, other white light phenomena such as faculae can also be counted and recorded separately.
Large sunspots that become visible to the naked eye through a safety filter should also be noted. Also record how many days the spot was visible to the naked eye.
Map sunspot locations
On your images of the Sun it’s useful to record where sunspots appear. But the Sun’s rotational axis varies in position relative to equatorial north over the course of a year.
The apparent rotation and tilt of the Sun are known as P0 and B0 respectively, and the current value of heliocentric longitude on the centre of the Sun’s disc as L0.
This information can be obtained from software such as Tilting Sun, Helio and WinJupos (see the list of software at the top of this article).
With Helio and WinJupos you can also record the heliocentric latitude and longitude of groups and individual spots. Here’s how
to do that with your images.
Step-by-step
Step 1
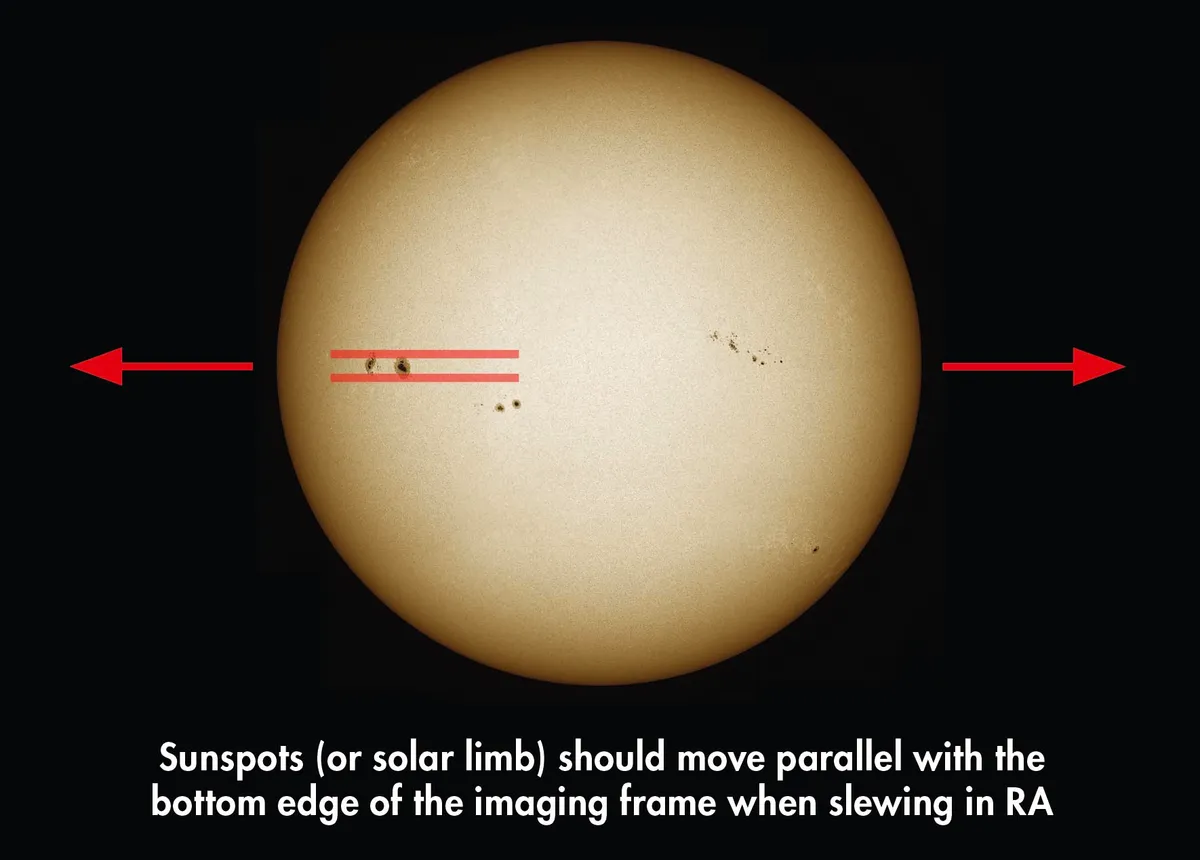
Using an equatorial scope, orientate the camera so features move parallel to the bottom frame edge when slewing in RA. Slew south in dec.: the northern limb will touch the frame edge first.
Step 2
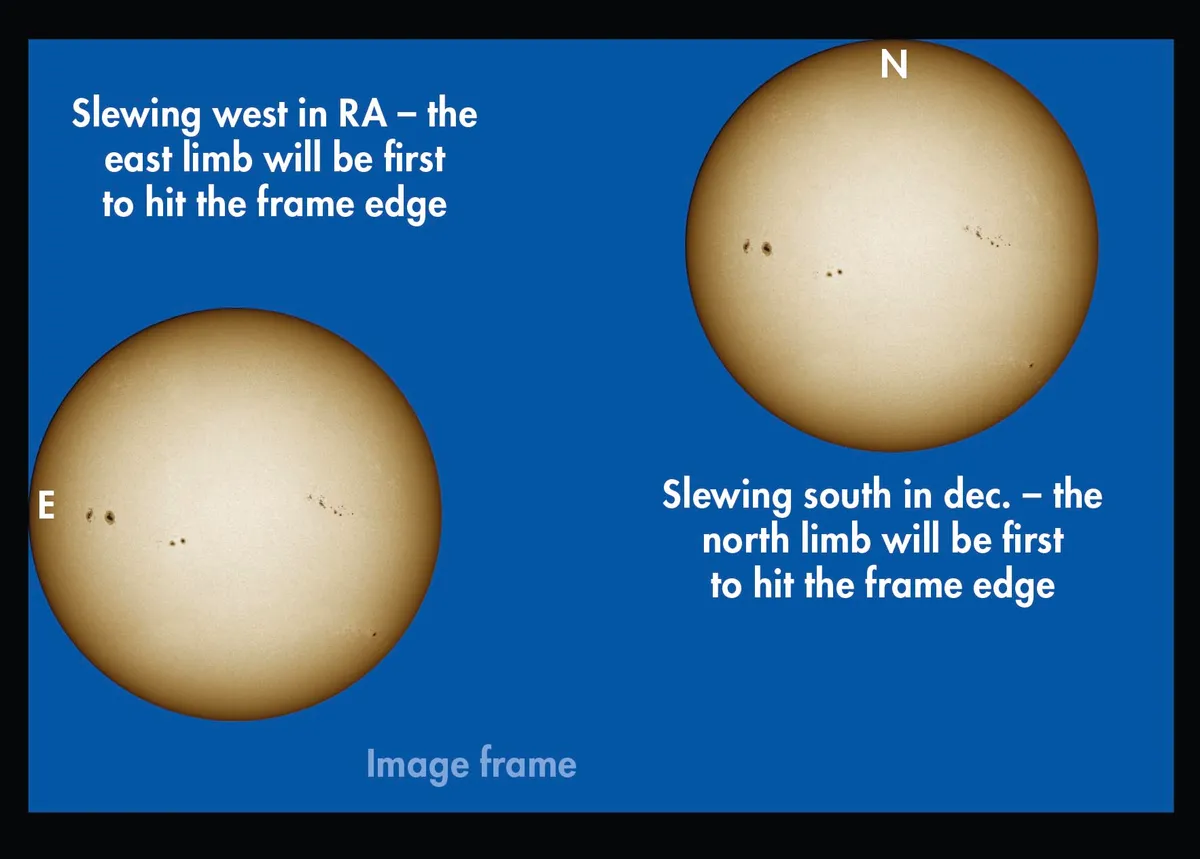
Slew in RA towards the west. The eastern limb will touch the frame edge first. Focus and take your full disc images. If the disc is too large, mosaics work just as well.
Step 3
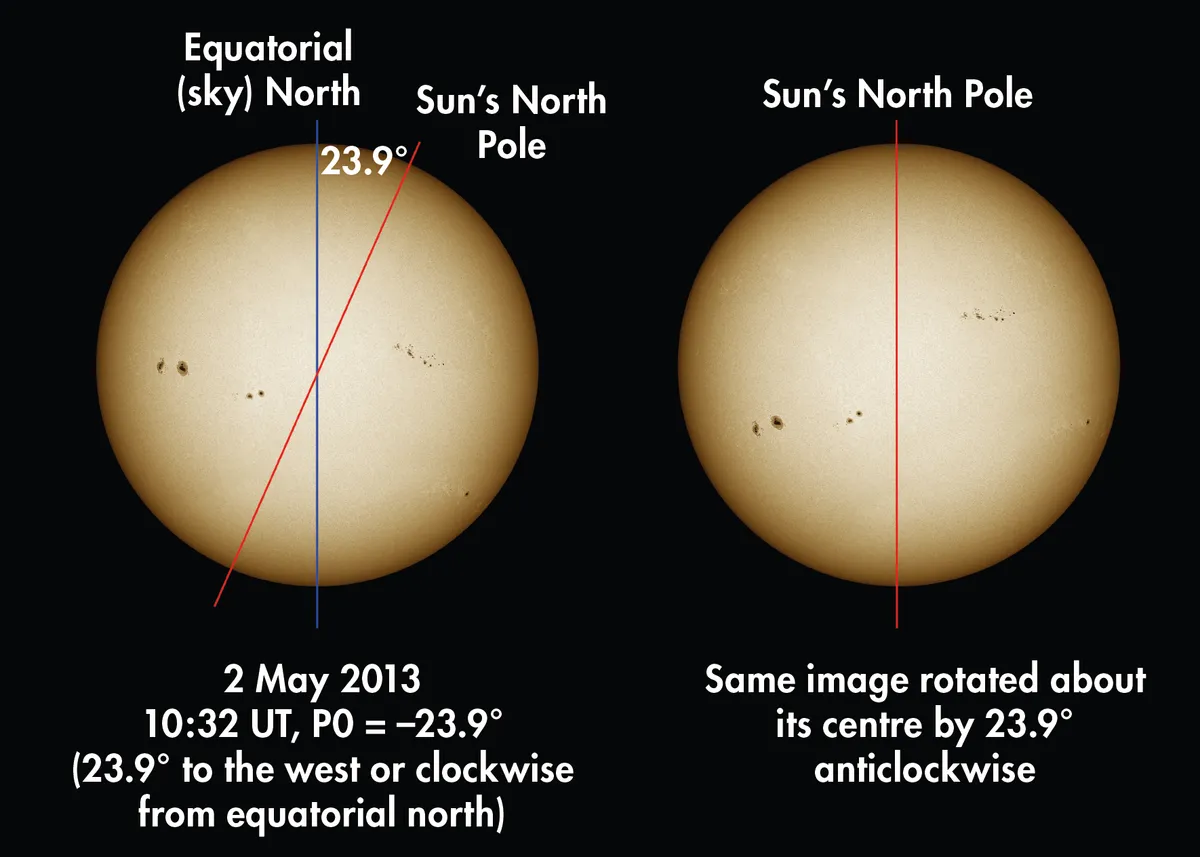
Helio and Tilting Sun show the apparent disc rotation (P0) relative to equatorial north. Load your processed image, north up, into an editor. Rotate by P0º so the solar north pole is at the top.
Step 4
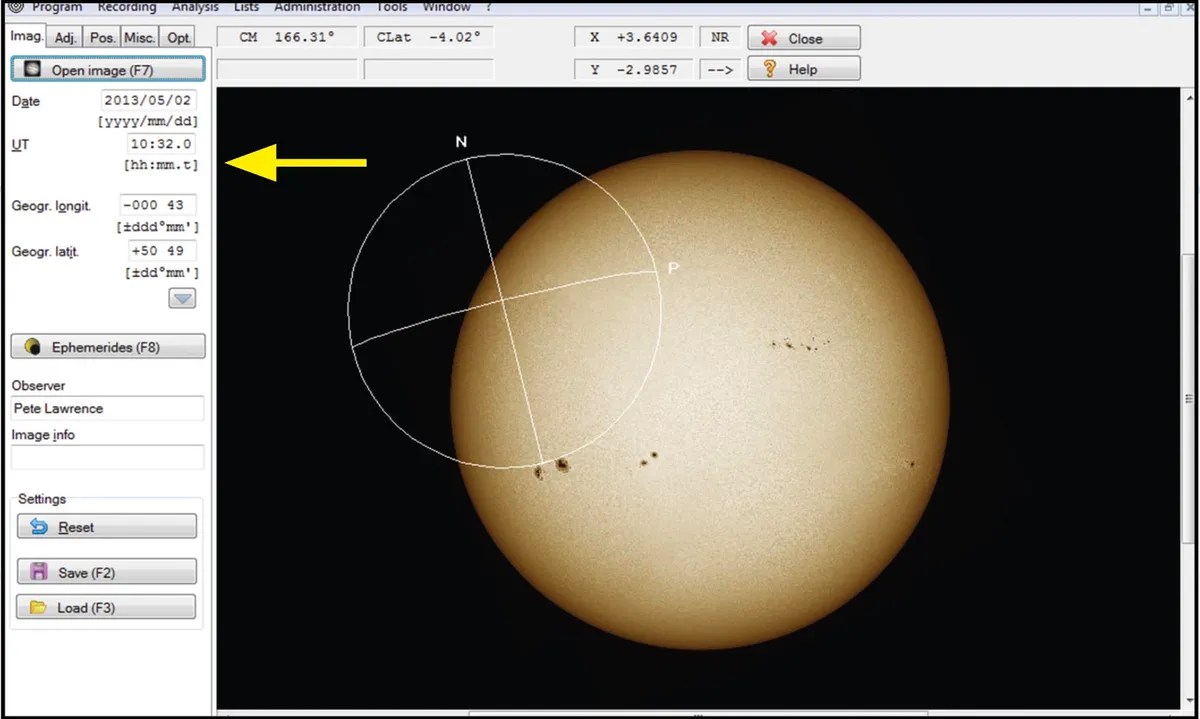
In WinJupos, click Program > Celestial Body > Sun and Recording > Image Measurement. Open your image. Set date, time and location in the Imag. tab, then Outline Frame > Automatic Detection in the Adj. tab.
Step 5

Tweak the frame to match the Sun’s outline. N should be at the top (north), P to the right (west). Rotate with N/P keys, resize with PgUp/PgDn. Switch to Imag. tab and save.
Step 6
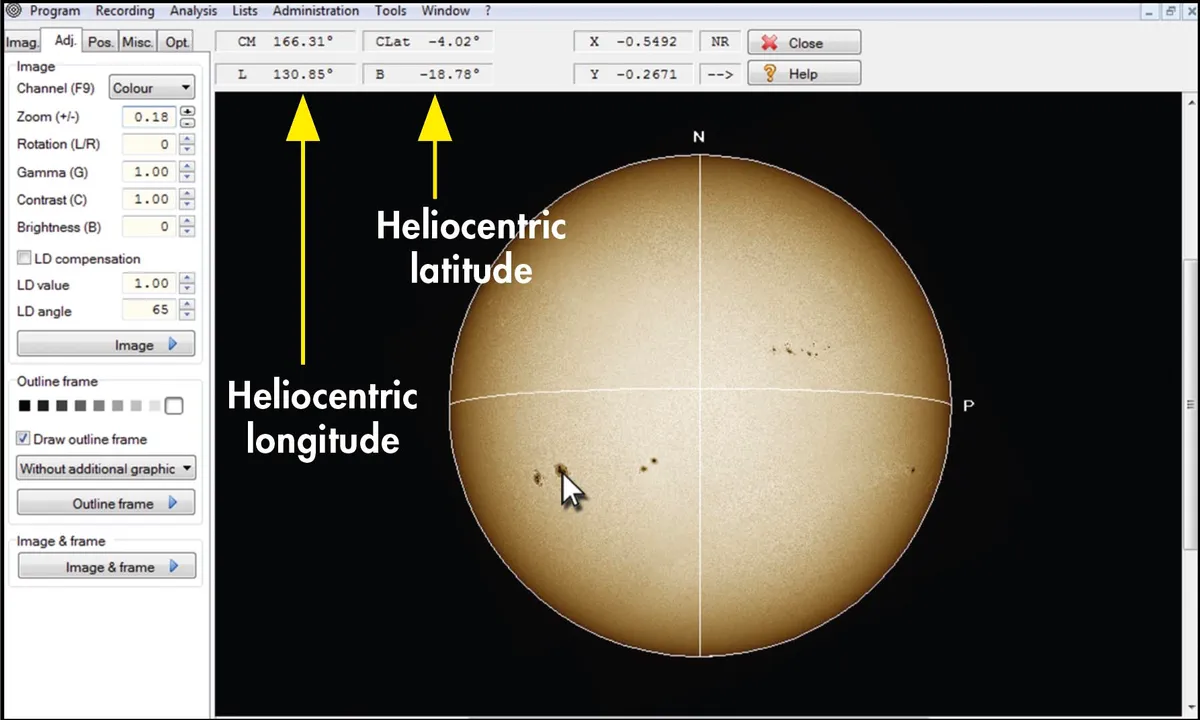
A spot group or individual spot’s position can be determined by moving the cursor over the feature and reading the L and B values from the status boxes to the upper left of the image.
For more on observing these features, read our guide on how to observe sunspots.
Record hydrogen-alpha features on the Sun

The Sun in hydrogen-alpha looks completely different to the white light Sun, with features like plage, prominences, filaments and flares becoming visible.
A record of how many hydrogen-alpha features are present on a day-to-day basis provides valuable information. These images are best achieved using a mono camera fitted to a hydrogen-alpha filtered scope.
Date and time must be recorded on each image as some features change on timescales of minutes or seconds.
Prominences can appear singly or in groups known as hearths; observational records of them should include quantity, type, position and size.
There are a number of ways to classify prominences, which all generally begin by defining whether a feature belongs to an active region or is isolated and inactive.

The technique outlined in Project 2 can be adapted to determine the disc positions of hydrogen-alpha features.
For part-disc images, as long as image orientation is known (see Project 2) and part of the limb is shown you can augment the image with a positional grid.
Use the freeware Tilting Sun to create a correctly oriented heliocentric latitude/longitude grid. Generate a dark disc with a light grid, then copy and paste this to your hydrogen-alpha image as a new layer and with 50% transparency.
Rescale it to give a best fit on both limbs. Next make the grid opaque, change its blend mode to Lighten and adjust the grid layer’s transparency to suit.
Prominence heights can be determined by estimating how high they are in solar radii. Multiplying this value by 700,000 will provide a height estimate in kilometres.
Another important phenomenon is the flare: a huge release of energy associated with the realignment of the Sun’s magnetic fields.
Imaging flares as they occur helps decode how they work, and you can get an alert for impending flare activity by monitoring the GOES satellite’s X-ray flux graph (http://legacy-www.swpc.noaa.gov/rt_plots/xray_1m.html).
Submit your solar records to the British Astronomical Association
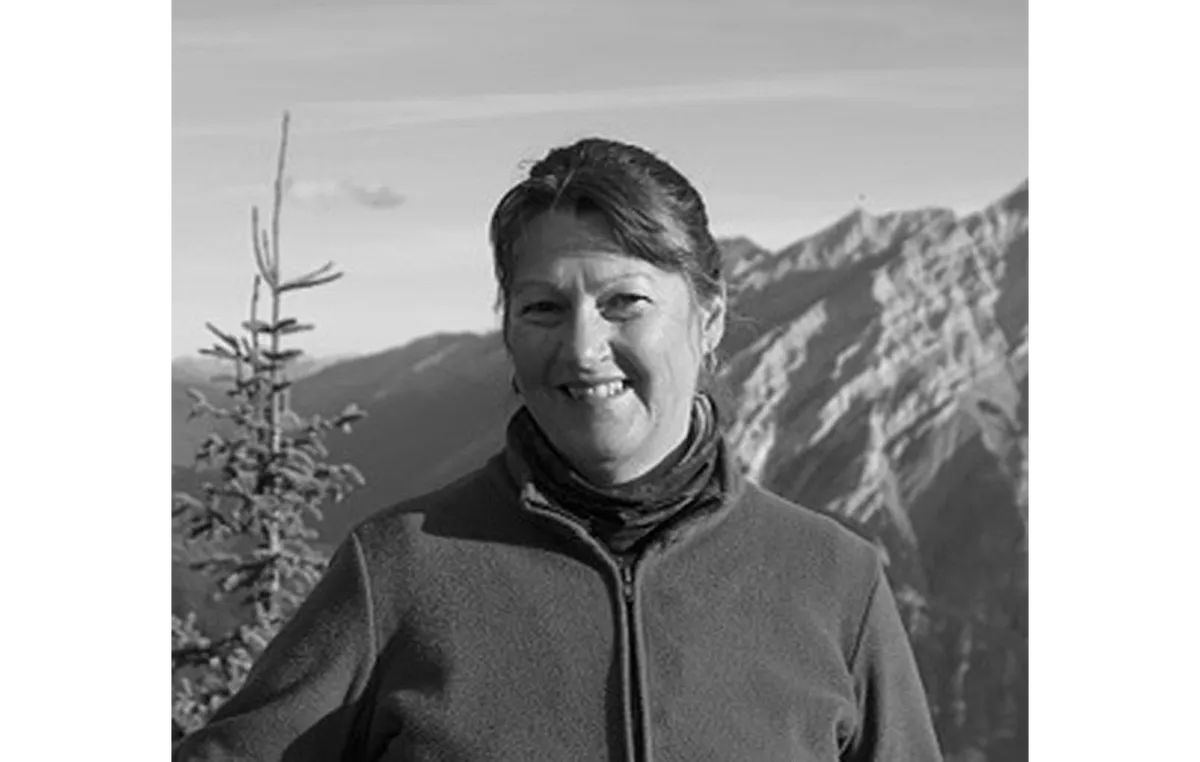
“You can make a meaningful contribution to astronomy by observing the Sun,” says Lyn Smith, solar section director for the British Astronomical Society (pictured).
“The BAA Solar Section contributes to the World Data Centre in Brussels, responsible for the International Sunspot Number.
“Images of the Sun in white light, hydrogen-alpha or calcium K wavelengths are welcomed whether they’re whole disc images or profiles of specific active regions.
"They can be emailed to solar@britastro.org, and should be in JPEG format and less than 1MB in size. Images should have your initials, observation date and time in UT within the file name your work can be identified within the section archive.
“Drawings of sunspots, prominences and filaments are also encouraged. These should be done in pencil or ink: hydrogen-alpha features depicted in red, flares in deeper red or orange and white light faculae in yellow (or traced out in a series of pencil dots).
Ensure your name is included along with the observation date and time of the in UT. Add the solar rotation if known.”
Find out more at the British Astronomical Association Solar Section.
If you do manage to make some interesting observations or images of the Sun, please share them with us. Find out more about how to send us your astrophotos, or get in touch with us on Facebook, Twitter and Instagram.
Pete Lawrence is an experienced solar observer and a co-host of The Sky at Night. This article originally appeared in the October 2017 issue of BBC Sky at Night Magazine.